In this article
| Table of Contents | ||
|---|---|---|
|
Understanding API Metrics
Overview
The API dashboard wall displays API metrics that provide insights into your APIs. Accessible through You can access the API dashboard wall from the subtab on the SnapLogic Dashboard, the . The API dashboard wall comprises is composed of widgets that help you visualize various API metrics and details about your APIs. As an Org adminsadmin, you can monitor statistics that give a summary view of any selection of APIs within your Org. As a Pipeline developersdeveloper, you can track the consumption of your APIs, troubleshoot errors, and analyze performance (latency). Like Similar to the functionalities available on the Pipeline and Tasks dashboard tabs, you can view assets to which you have read and write permissions.Starting with the 4.23 SnapLogic Release (November 2020), the Native API Manager subscription feature adds monitoring capabilities that coincide with the new API Manager and API Developer Portal.
Troubleshooting Errors
The API dashboard serves as the central repository of information about your APIs when they are published to and consumed from the developer portal. As an Org admin, you can collect metrics on usage, latency, and the number and type of errors API consumers are facing. This data collection is an important part of managing API policies, because understanding these metrics can help you decide on the combination of policies that best protect the APIs published to your developer portal. Because the dashboard supports downloads, you can collect these metrics over time and analyze the patterns for trends in the way the APIs are used.
The dashboard separates response from target errors, making it easier to determine if the error occurred because of an API policy configuration or originated from the Pipeline runtime. Latency metrics facilitate fine-tuning the efficiency of your traffic control policies for your APIs. Furthermore, you can perform deep dive analysis from the dashboard, and easily access the Pipeline runtime of a target API. This capability allows API developers to fix issues at the Pipeline level and improve the service that the API provides.
Analyzing API Consumption
The API dashboard renders API usage metrics in visual and detail views. The API Details table lists APIs that are handling the most requests. The order of target APIs defaults to requests per minute, essentially giving you a view of the top ten APIs. You can also sort by error percentage and latency, so that you can analyze problems your API consumers are facing when ingesting APIs from your developer portal. These details combined with the widgets gives API developers the tools they need to analyze consumption trends and improve the user experience of their APIs.
API Metrics
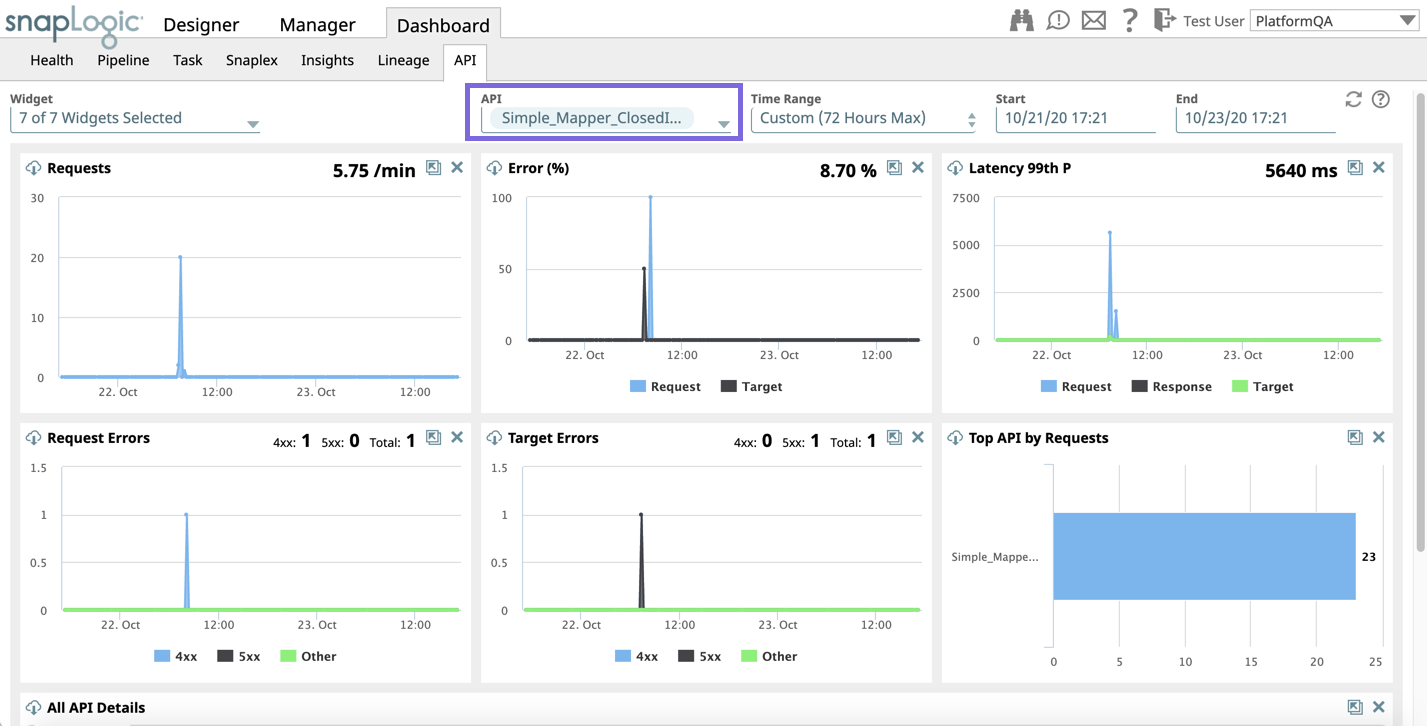
The dashboard displays area charts, where you can view metrics for your APIs:
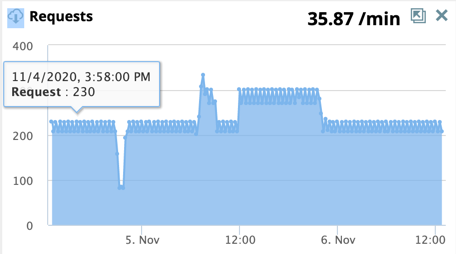
Requests: The number of requests during a selected time period (when hovering your cursor over the area chart). The chart displays requests per minute as a number on the top right of the chart, calculated as the the rate at which the system is processing requests.
For a 1-hour interval, the chart displays the aggregated number of requests processed each minute.
For 8-hr and bigger time intervals, the chart displays 15-minute data points as the indication of the throughput of the API ecosystem.
You can also use filters to see the value of this metric for your target APIs.
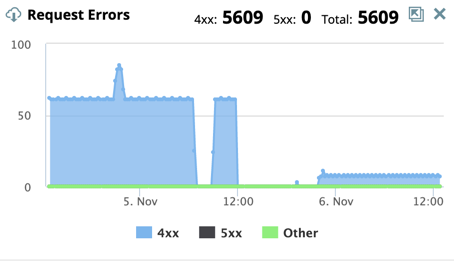
Request Errors: The 400 and 500 errors that occur, typically because of an API policy violation or fail authentication, resulting in a canceled request. Pipelines are not prepared or executed in this scenario.
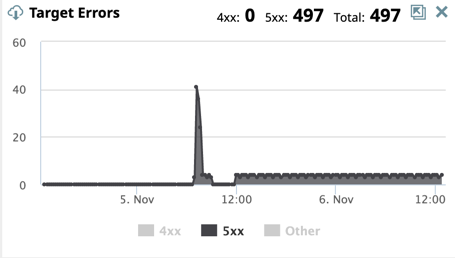
Target Errors: The 400 and 500 errors that occur during the Pipeline prepare and execution phase.
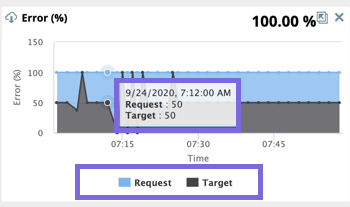
Error Percentage: The errors that occur with the API calls as a percentage of the total number of requests. This metric is indicative of ineffective API design, weak API documentation, and/or even malicious actors accessing the API ecosystem.
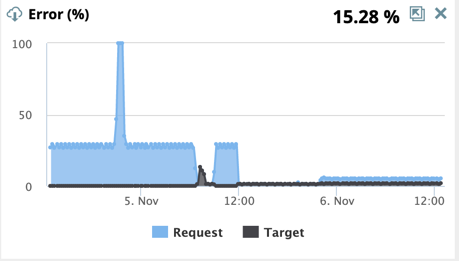
Request Errors: The errors that violate a policy or fail authentication and thus result in a canceled request. Pipelines are not prepared or executed in this scenario.
Target Errors: The errors that occur during the Pipeline prepare and execution phase.
99 Percentile Latency: Latency is the number of milliseconds it takes the API ecosystem to respond to a call. The 99p latency value means that 99 out of 100 API data samples fall below this value. This metric is indicative of the efficiency or the cycle-time of the API ecosystem.
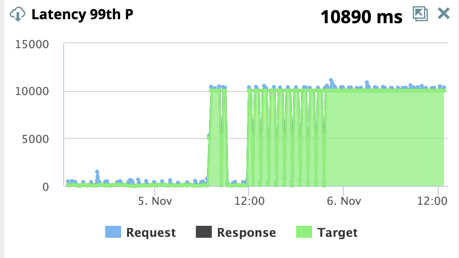
Request Latency: The time it takes to link the Task definition, run API policies, and authenticate the request in milliseconds (ms).
Target Latency: The time it takes to prepare and execute the Pipeline to completion in milliseconds (ms).
Response Latency: The time it takes to collect statistics and process the response to the caller in milliseconds (ms).
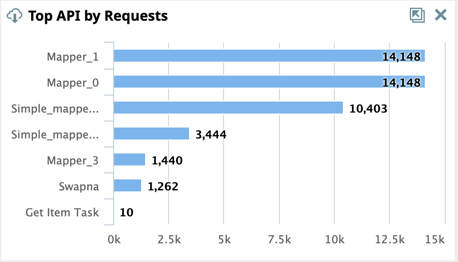
Top API by Request: This bar graph displays the top ten APIs in your Org by request.
Selecting a Widget
On the top left, click the Widgets selector, and select/deselect the widgets displayed on the dashboard wall. The default option is all widgets are selected.

Exploring the Widget
Within the graphs, you can hover your cursor over the data points to view the metrics for that period of time. Data points represent the total or the average value over a 15-minute period. Sliding the cursor along the trend line on the widget also displays the data points for that area of the graph. You can further specify which metrics to view by clicking the labeled colored squares below the graph.
Selecting the API
On the top inside right, click the API selector and from the dropdown menu, choose the Project Spaces and Projects that contain the APIs for which you want to view metrics. The default is all APIs in an Org.
You can also filter the results displayed in the API selector by entering a keyword in the Filter field: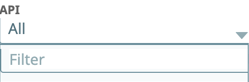
Customizing API Dashboard
Overview
You can customize the API dashboard to do the following:
View data over different date ranges.
View/hide the available panels.
Change the layout.
Selecting a Time Range
You can customize the API Dashboard to view data for a different time period. Click any one of the following options to change the time range:
1 Hour: View the statistics for the last hour.
8 Hours: View the statistics for the last eight hours.
24 Hours: View the statistics for the last 24 hours.
Custom: View the statistics for a target time period of days/hours, limited to last seven days.
Note title Customized Date Ranges When selecting the date range, the value for the End date is automatically adjusted to a maximum span of 72 hours once you choose the Start date. You cannot select a time period greater than 72 hours.
Viewing and Hiding the Available Panels
You can view the metrics for each API in the specified period in the All API Details table. Clicking on the API call opens a separate window with details of that API.
| Info |
|---|
|

Changing the layout
To view the API dashboard, click Dashboard > API. By default, SnapLogic displays data for the past hour.
Analyzing Request Details
All API Details
You can drill down further and analyze usage and other statistics in the All API Details report.
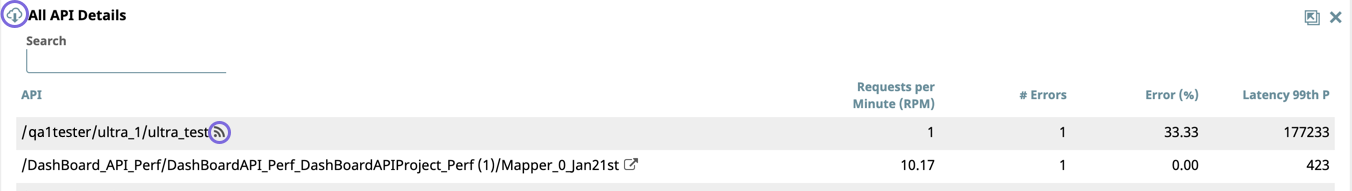
The report lists all the APIs that have been called from the Developer Portal, allowing you browse easily and view their metrics.
- Click on the column header to sort by one of the following metrics:
- Requests per Minute (RPM)
- Number(#) of Errors
- Error (%)
- Latency 99th P
- Click
 to download a CSV summary of the information.
 - Click
 to launch a display of Task details view for a target API.
Request Details
When you click on the name of an API, the request details view is displayed, offering you more details about a particular API request.
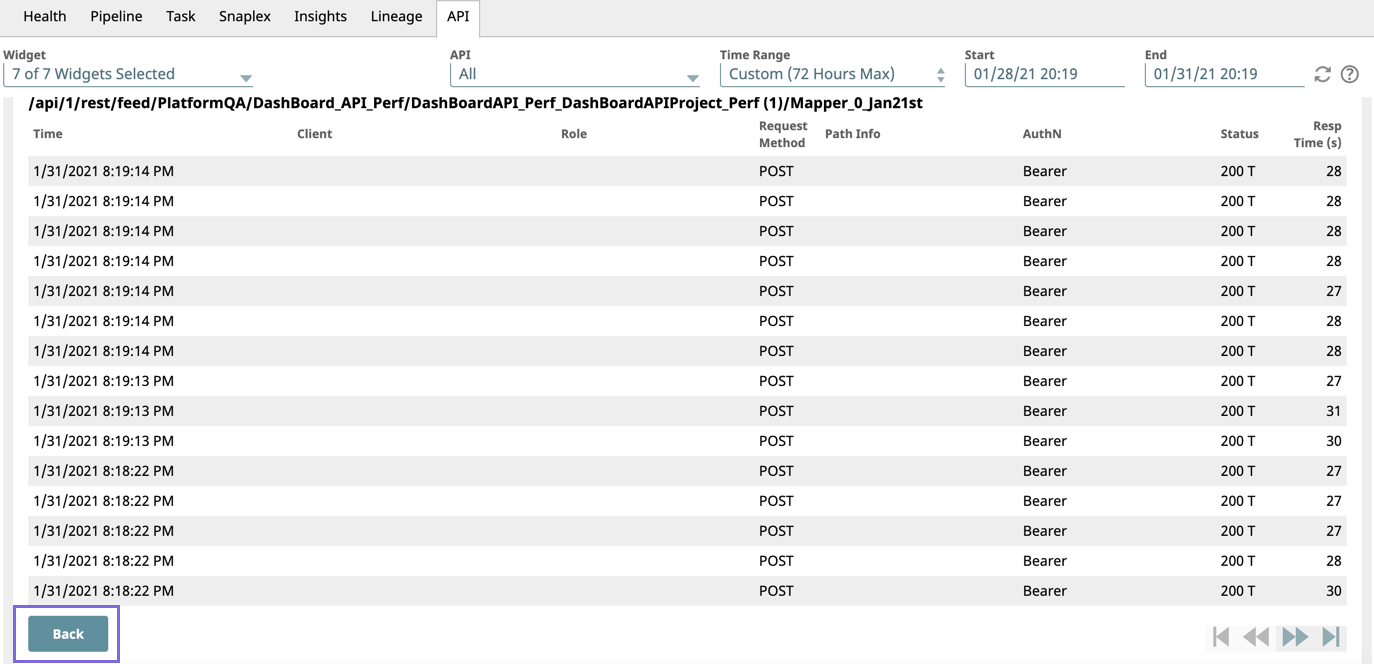
- Time: The day and time that the API was called.
- API: The API endpoint.
- Client: The client identifier.
- Role: User role (if defined).
- Request Method: The type of HTTP Method of the API call.
- Path Info: The name given to the path.
- AuthN: The authentication type used to authenticate the request, if present.
- Status: The response status, stated as an HTTP code. The status also displays a T or R affix to the code to indicate if the response is from the target or the request.
- Resp Time: The time it takes in milliseconds (ms) between the client request being received and the response returned to the client.
Clicking Back returns to the All API Details view.