...
Click an execution to view its details. Pipeline execution details include information on its Snaps and parameters, and give you access to errors and logs. For each Snap, you can determine how long it took, how much data and the number of documents that were processed, and at what speed. Learn more about Execution details. <fix this link when deployed>.
...
Your Org might execute tens of thousands of Pipelines in a short time period. The Execution overview page provides controls for finding the executions of interest and viewing relevant details. Before using these controls, you can set the time period to the smallest window possible to reduce the number of executions in the list. The following sections provide procedures for:
| Anchor | ||||
|---|---|---|---|---|
|
...
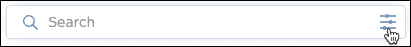
In the Search bar, click the options icon to display the Advanced filtering dialog:
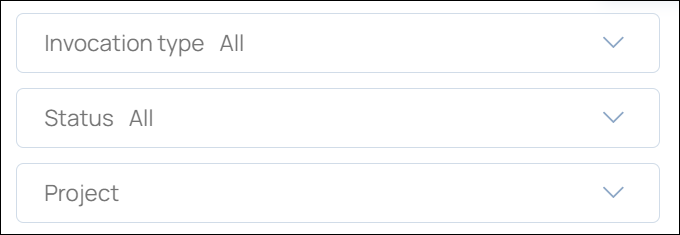
In Advanced filtering, click the type of filter to apply.
The first filters in the menu have pull-down options:

The last filters in the menu accept text entries:

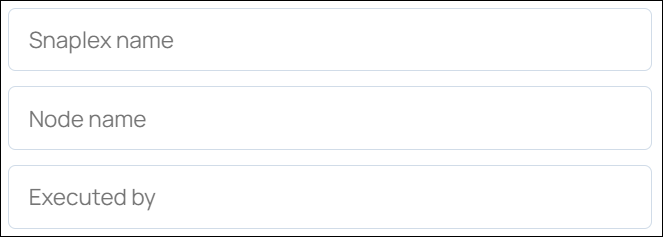
Add filters and click Apply.
...
The following sections provide procedures for using the Execution overview for analysis and troubleshooting. Before using these controls, you can also set the time period to the smallest window possible to reduce the number of executions in the list.
| Anchor | ||||
|---|---|---|---|---|
|
...
Click an execution to view its details. Pipeline execution details include information on its Snaps and parameters, and give you access to errors and logs. For each Snap, you can determine how long it took, how much data and the number of documents that were processed, and at what speed. Learn more about Execution details. <fix this link when deployed>.
...
Your Org might execute tens of thousands of Pipelines in a short time period. The Execution overview page provides controls for finding the executions of interest and viewing relevant details. Before using these controls, you can set the time period to the smallest window possible to reduce the number of executions in the list. The following sections provide procedures for:
| Anchor | ||||
|---|---|---|---|---|
|
...
In the Search bar, click the options icon to display the Advanced filtering dialog:
In Advanced filtering, click the type of filter to apply.
The first filters in the menu have pull-down options:
The last filters in the menu accept text entries:
Add filters and click Apply.
...
The following sections provide procedures for using the Execution overview for analysis and troubleshooting. Before using these controls, you can also set the time period to the smallest window possible to reduce the number of executions in the list.
| Anchor | ||||
|---|---|---|---|---|
|
...