...
Open the Studio Metrics page to monitor and troubleshoot node behavior:
In the navigation pane under Analyze, select Metrics:
Select a node in one of the following ways:

Start entering text to search for a node by name.
Click the node dropdown arrow to browse by Snaplex and click a Snaplex to display its nodes.
The Metrics page displays: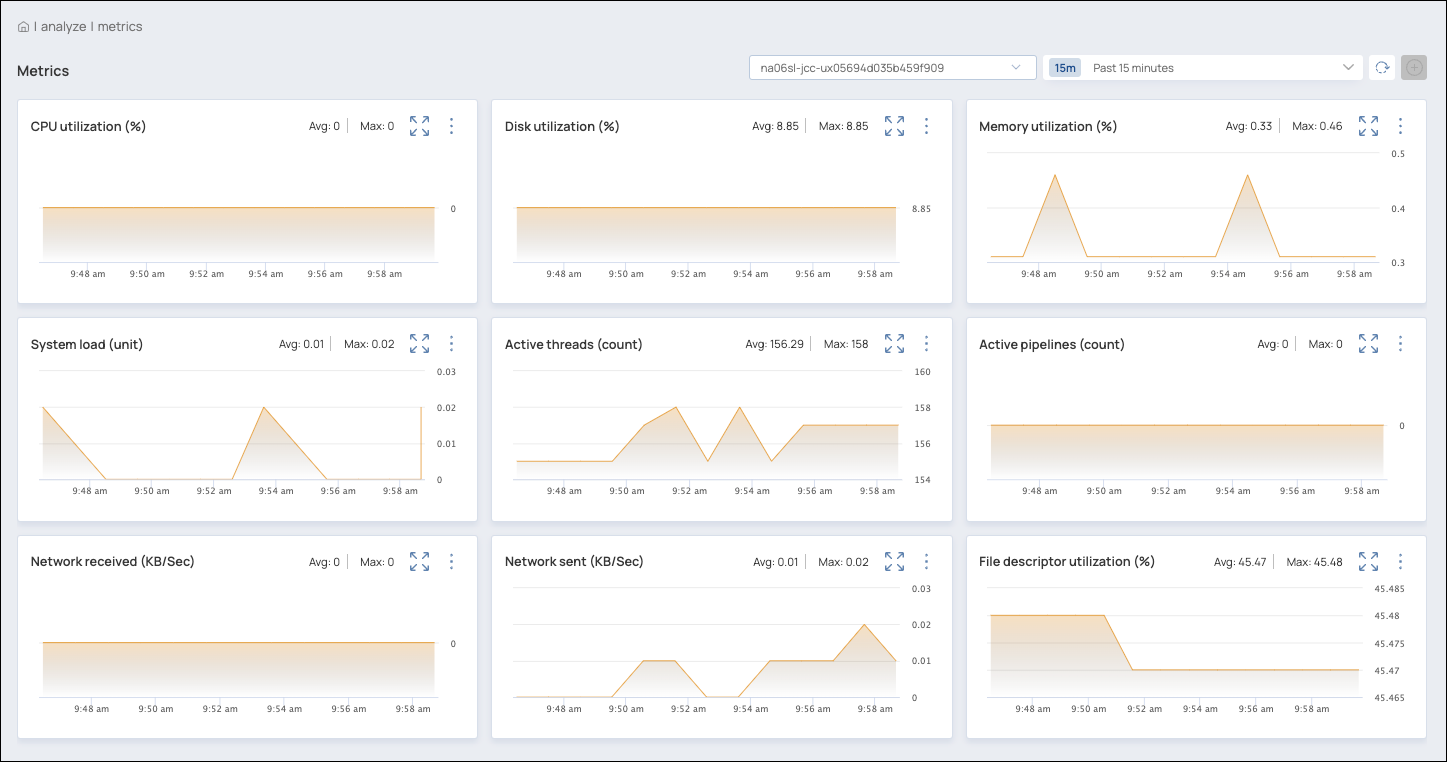
The charts report the average value, maximum value, and trends for:
...
In a regular or expanded chart, hover over the plot to view values for individual data points. For example, to determine why memory use spiked, you might want to check the number of pipelines that were running at the same time. Do that on the Studio Metrics page by hovering over a chart to view data point values. The value indicator tracks the same point in time for all charts:
...
You can also drag your cursor to zoom in on a shorter period of time, as shown in the following video:
...
To view details for a Pipeline execution during a specific time period:
In the chart of interest, click
 to expand it.
Drag your cursor across the plot to select a time period as shown in the video in the section above.
A table of Pipeline executions displays:
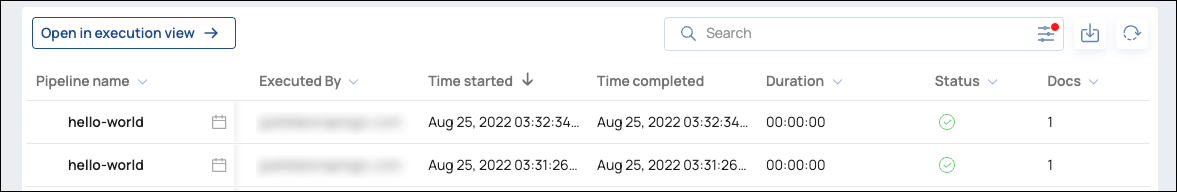
Click
to download the Pipeline data in .csvformat.To view more details, do one of the following:
Open the Execution overview (filtered to show these Pipelines) by clicking Open in execution view.
Click a Pipeline name to open its execution details. From the Pipeline execution details, select the Pipeline Logs tab to view and download logs.
Downloading Chart Data
To download chart data:
...