Viewing Pipeline Runtime Logs
The Pipeline Wall Wall enables you to view runtime logs for a specific Pipeline execution.
| Note |
|---|
Org admins can see all Pipelines run in an Org, while users can only see the Pipelines to which they have access. |
To view the runtime logs for a Pipeline:
- In SnapLogic Dashboard, click the Pipeline tab.
In the Status column of the target Pipeline, click
 to display the Pipeline Execution Runtime Logs.
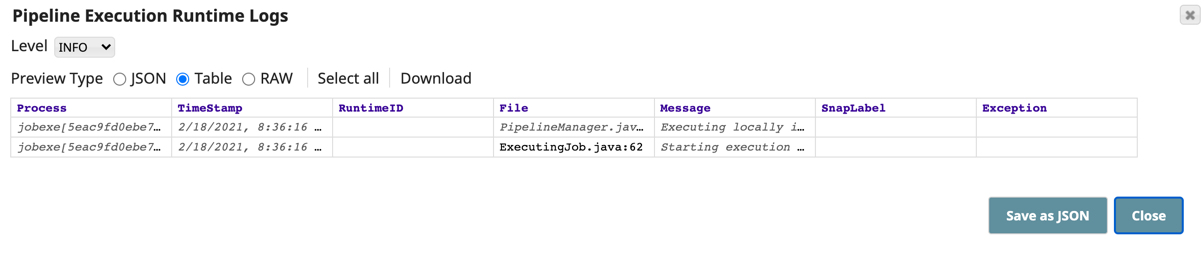
Note title No icon displayed If a Snaplex does not have logs enabled, the runtime log icon is not displayed.
From the Pipeline Execution Runtime Logs, you have the following options:- Preview type: Click one of the following data format types for viewing the logs:
- JSON
- Table (default selection)
- Raw
- Select All: Highlight all information in the logs
- Download: Save the logs to your Downloads folder.
- Preview type: Click one of the following data format types for viewing the logs:
- Click Save as a JSON file to save the logs or Close to exit back to the Pipeline tab.
| Info |
|---|
Some Pipeline executions display a warning icon next to their status to make them easy to identify: |

Runtime Log Information
The runtime logs display the following information:
- Process
- Timestamp
- Runtime ID
- File
- Message
- Snap Label
- Exception