| Panel | ||
|---|---|---|
| ||
This page is no longer maintained (March 29, 2023). For the most current information, go to Analyze and Monitor Studio. |
On this page:
| Table of Contents |
|---|
...
To view your Pipeline executions:
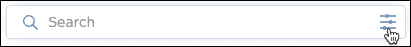
In the Search bar, click the options icon:
In Advanced Options, click Executed by and start entering your username.
When your username displays, click + to select it.
Click Apply.
The execution list updates to reflect the filter. The options icon has a red decorator to indicate a filter was applied. The filter remains until you remove it.
...
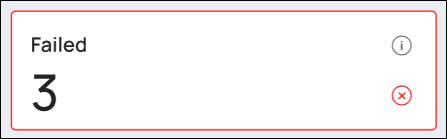
To view the details of a failed Pipeline or Task:
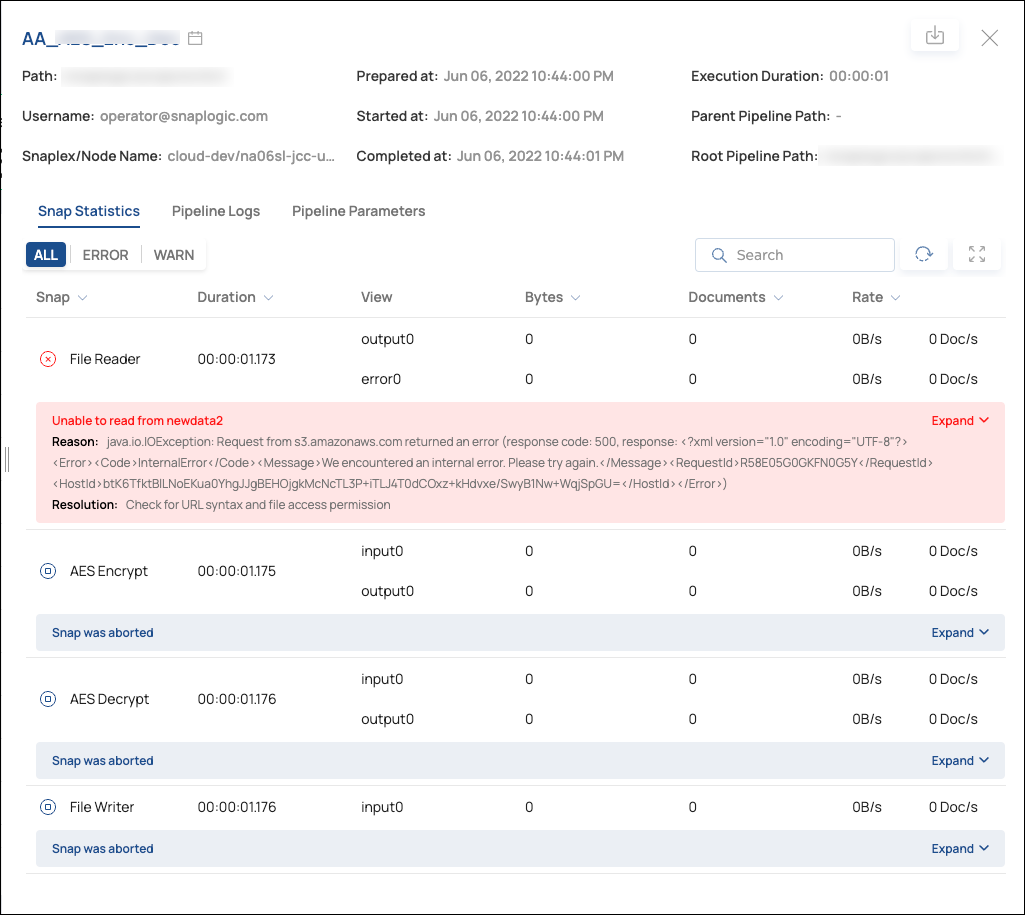
Click the Failed summary card:
In the execution list, click the Pipeline or Task of interest to display details.
| Anchor | ||||
|---|---|---|---|---|
|
To use advanced filtering:
In the Search bar, click the options icon to display the Advanced filtering dialog:
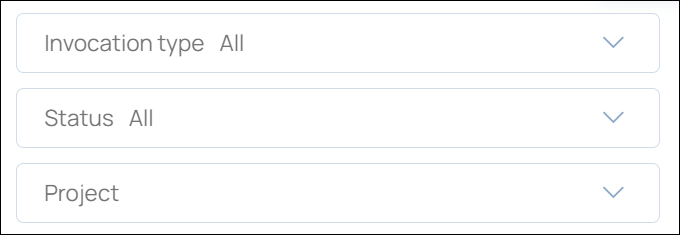
In Advanced filtering, click the type of filter to apply.
The first filters in the menu have pull-down options:
...
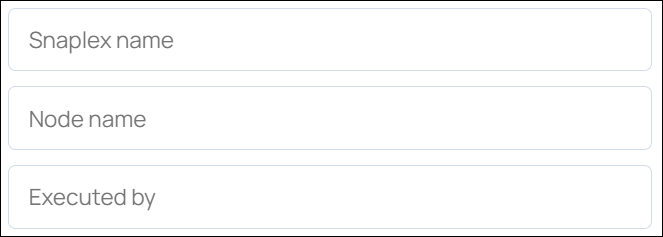
The last filters in the menu accept text entries:
...
Add filters and click Apply.
The filters apply to subsequent searches and to the execution list until you remove them. A red dot decorates the options icon to remind you that filters are applied.
...
To find executions for a Project:
In the Search bar, click the options icon to display the Advanced filtering dialog:
In Advanced filtering, click the type of filter to apply.
Click Project to open the list of Project Spaces:
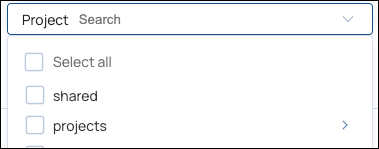
Click a Project Space to open the list of Projects:
Select the Project to search.
Viewing and Analyzing Execution Details
...
To add, remove, and rearrange columns:
In the Search bar, click the options icon:
The Advanced filtering dialog displays.
In the Column Preferences section:
Click x on a shaded column to remove it.
Click + on an unshaded column to add it.
Drag shaded columns to rearrange the order in which they display in the table.
Click Apply.
| Anchor | ||||
|---|---|---|---|---|
|
...
The Group by: control aggregates executions by Pipelines or by the Tasks that initiated them. To aggregate executions, follow these steps:
Next to Group by:, click Pipeline or Task.
The execution list displays Pipelines or Tasks.Locate the Pipeline or Task of interest and click it.
The details panel displays a list of Pipeline executions. This aggregated Pipeline example is sorted by Status to show failed executions at the top: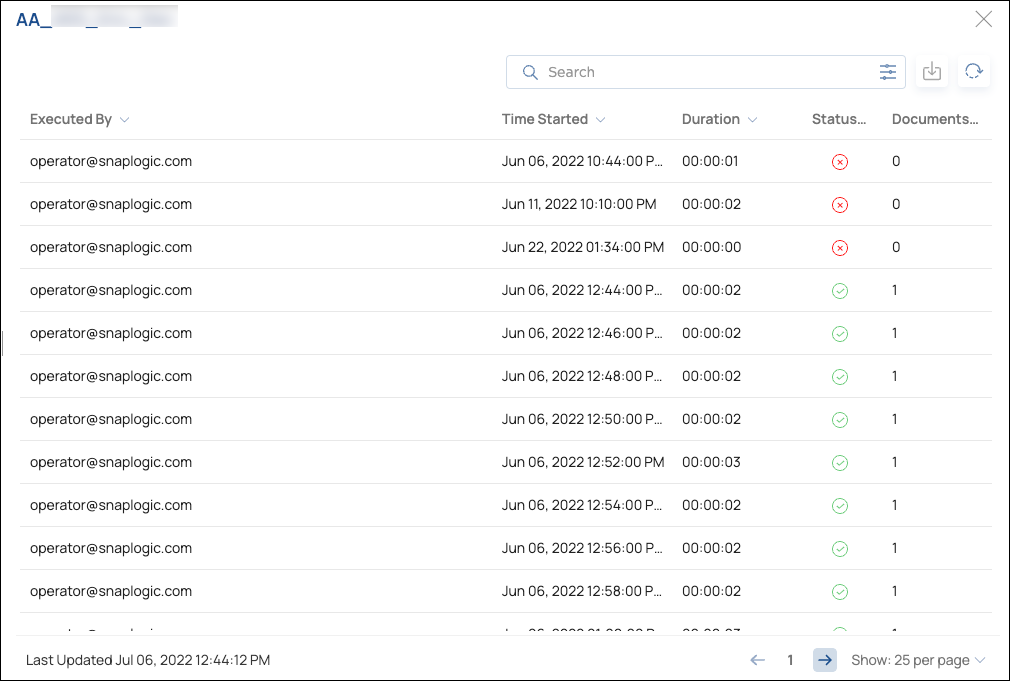
Click an execution to view the Pipeline details:
To return to the unaggregated list of executions, click the selected Pipeline or Task button to clear it.
...