| Table of Contents |
|---|
Overview
...
To view Tasks on the Dashboard, you must either be an Org admin or the user who has Read Access permissions a user with read access to the Project where the Task is located. For details about user permissions at the Project level, see Project Spaces.
...
Click Dashboard > Task.
Info Panels with
 signify completed Tasks, and panels with
  signify failed Tasks.
- Choose the type of Task from the drop-down menu to filter results.
- Scheduled
- API Calls (also known as Triggered Tasks)
- Ultra
- Click on any of the Task panels to view the Metrics tab, which displays an interactive graph showing the execution statistics for the current day.
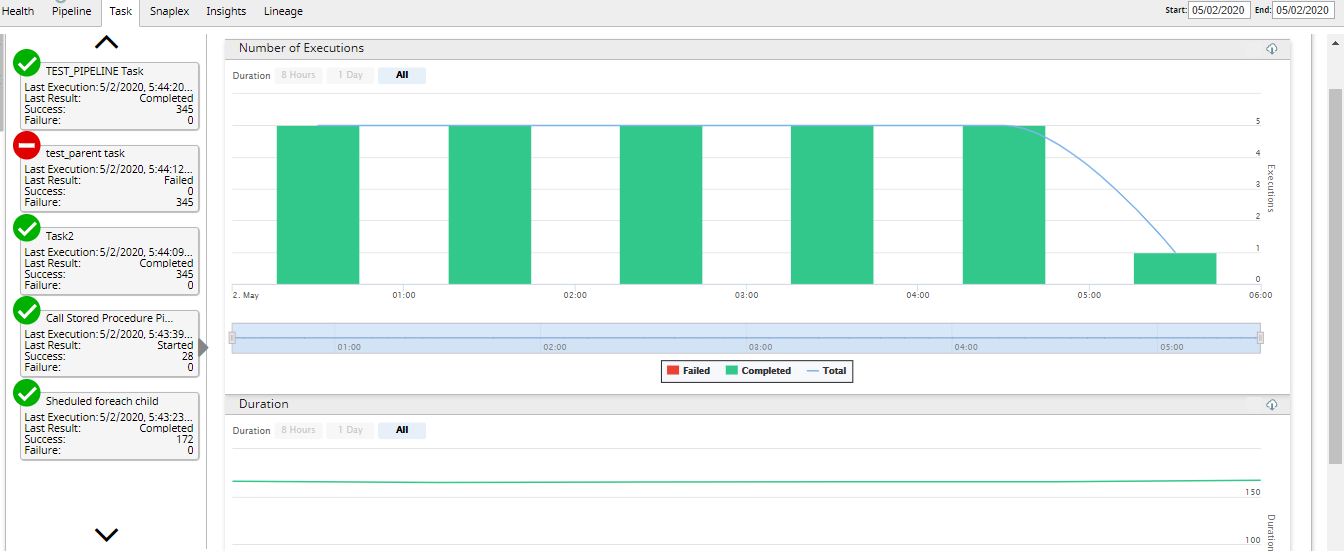
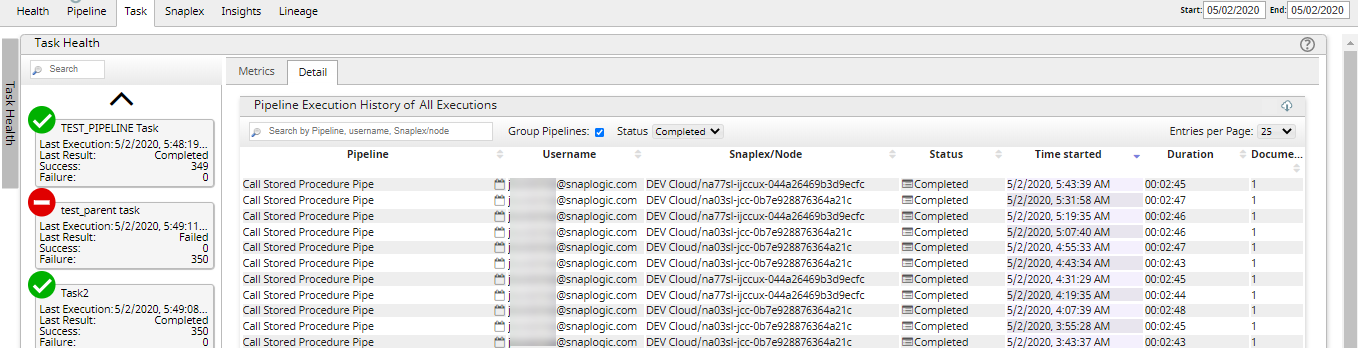
Click on the graph or on the Detail tab to view the execution details for the specific hour you click.
Note When you click on an Ultra Task, only the Metrics tab is displayed.
...
| Info |
|---|
Click on |

Number of Executions
The Number of Executions section of the graph displays the total number of failed and completed Task executions. The slider bar below the graph helps you slide to the required duration in the specified time range.
...