SnapLogic Dashboard is a reporting interface that provides information on Pipeline executions and Snaplex instances.
| Panel | ||||
|---|---|---|---|---|
| ||||
In this section
|
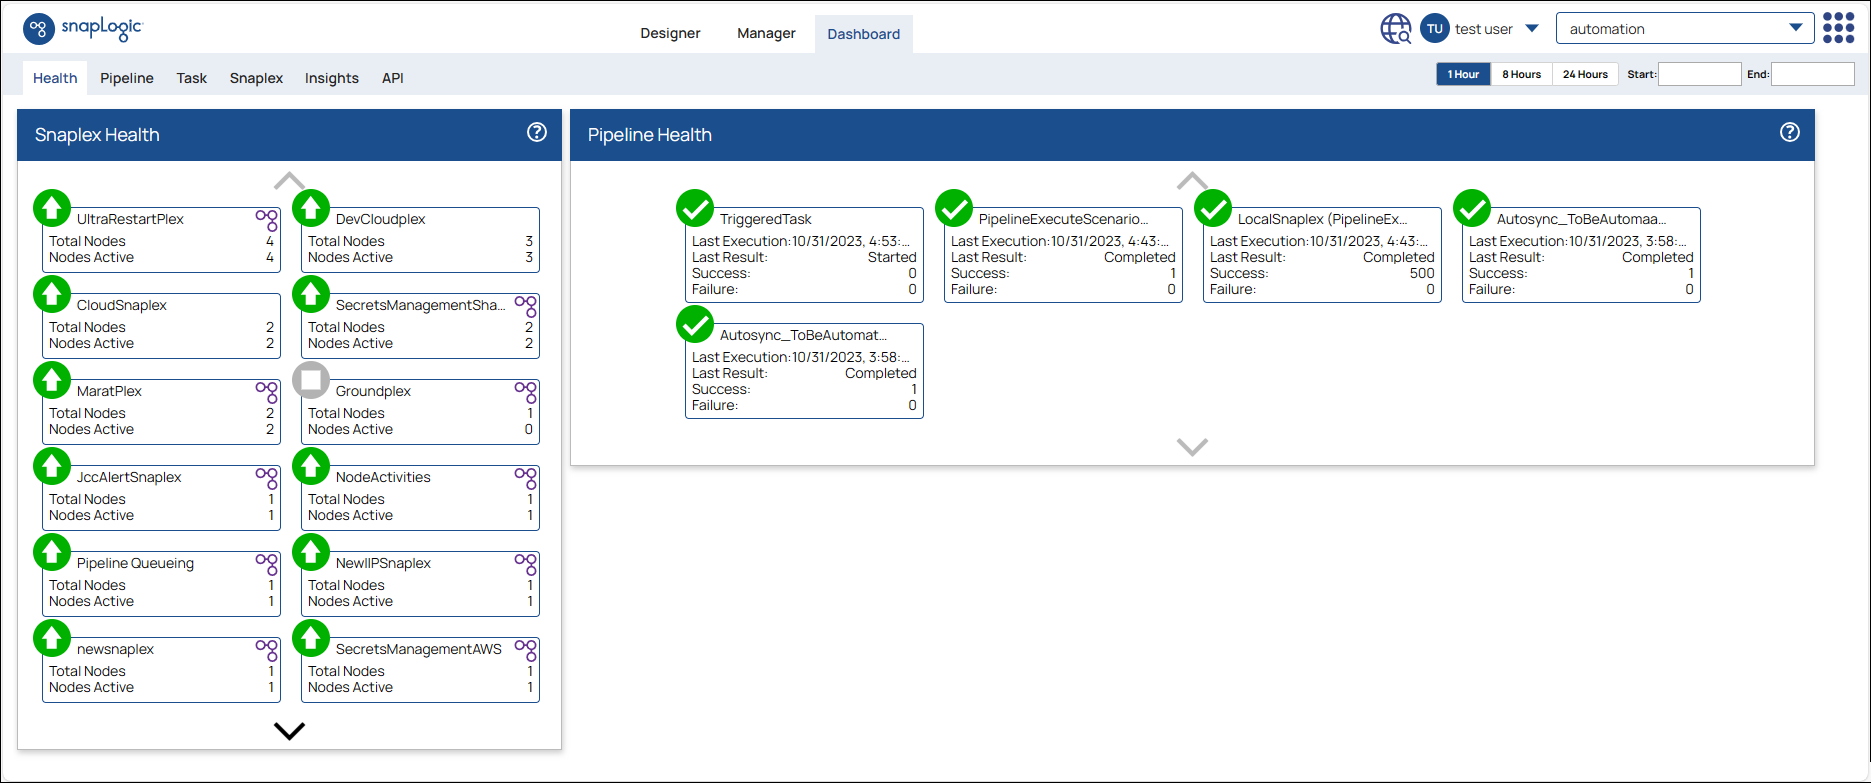
The Health tab displays the available Snaplex instances, whether they are up or down, as well as their CPU and memory usage. Green are running Snaplex instances, yellow are instances that were shut down gracefully, and red indicates a system crash.
The Pipeline tab displays the Pipeline Run History, including the run status, run time, and duration.
The Task tab offers details on the execution status of Scheduled and Triggered tasks for a specific time range.
The Snaplex tab displays graphs for active Pipelines, executed Pipelines, active nodes, and Pipeline distribution. You can change the duration displayed in each graph by selecting the duration buttons and select data for specific nodes.
The Insights tab is available only to org admins and offers interactive graphs that help you visualize Org-level Pipeline-execution statistics for a specific date range.
The Lineage tab enables you to view the historical lineage of documents in relation to the Pipelines that process those documents.
The API tab displays graphs for the APIs in your Org. You can view metrics about usage and response errors by selecting the duration buttons.