On this Page
| Table of Contents | ||||
|---|---|---|---|---|
|
Overview
This Snap performs Principal Component Analysis (PCA) on an input document and outputs a document containing fewer dimensions (or columns). PCA is a dimension-reduction technique that can be used to reduce a large set of variables to a small set that still contains most of the information in the original set. In simple terms, PCA attempts to find common factors in a given dataset, and ranks them in order of importance. Therefore, the first dimension in the output document accounts for as much of the variance in the data as possible, and each subsequent dimension accounts for as much of the remaining variance as possible. Thus, when you reduce the number of dimensions, you significantly reduce the amount of data that the downstream Snap must manage, making it faster.
PCA is widely used to perform tasks such as data compression, exploratory data analysis, pattern recognition, and so on. For example, you can use PCA to identify patterns that can help you isolate specific species of flowers that are more closely related than others, as in our example below.
How does it work?
The PCA Snap performs two tasks:
- It analyzes data in the input document and creates a model that
- Reduces the number of dimensions in the input document to the number of dimensions specified in the Snap.
- Retains the amount of variance specified in the Snap.
- It runs the model created in the step above on the input data and offers a document containing the processed output, offering a simplified view of the data, making it easier for you to identify patterns in it.
Input and Output
Expected input
- First input view: Required. A document containing data that has numeric fields.
- Second input view: A document containing the model (or mathematical formula that performs a transformation on the input data) that you want the PCA Snap to use on the data coming in through the first input. If you do not provide the model, the PCA Snap builds a model that is best suited for the input data provided through the first input.
Expected output
- First output view: A document containing transformed data with fewer (lower) dimensions.
- Second output view: A document containing the model that the PCA Snap created and used on the input data. If you supply the Snap with the model (created using a PCA Snap earlier) that you want to use, the Snap does not output the model. To see this behavior in action, see the example below.
Expected upstream Snaps
- First input view: A Snap that provides a document containing data in a tabular format. For example, a combination of File Reader and CSV Parser, or Mapper.
- Second input view: A Snap that provides documents. For example, a combination of File Reader and CSV Parser.
Expected downstream Snaps
- Any Snap that accepts a document. For example, Mapper or CSV Formatter.
Prerequisites
- The input data must be in a tabular format. The PCA Snap does not work with data containing nested structures.
Configuring Accounts
Accounts are not used with this Snap.
Configuring Views
Input | This Snap has at most two document input views. |
|---|---|
| Output | This Snap has at most two document output views. |
| Error | This Snap has at most one document error view. |
Troubleshooting
None.
Limitations and Known Issues
None.
Modes
- Ultra Pipelines: Works in Ultra Pipelines when the Snap has two input views and one output view.
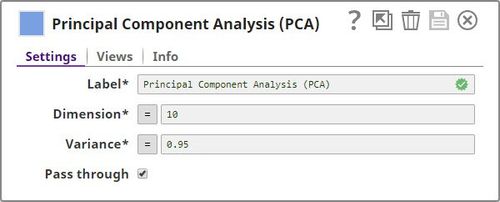
Snap Settings
| Label | Required. The name for the Snap. Modify this to be more specific, especially if there are more than one of the same Snap in the pipeline. |
|---|---|
| Dimension | Required. The maximum number of dimensions–or columns–that you want in the output. Minimum value: 0 Maximum value: Undefined Default value: 10 |
| Variance | Required. The minimum variance that you want to retain in the output documents. Minimum value: 0 Maximum value: 1 Default value: 0.95 |
| Pass through | Select this check box to include all the categorical input fields in the output. |
Example
Visualizing the Iris Flower Classification Dataset in Two Dimensions
In this example, you take a CSV file containing the length and width of the sepals and petals of different species of Iris flowers. You then apply PCA to reduce the number of dimensions to two. This enables you to visualize the flower distribution based on the size of their sepals and petals, using a scatter plot.
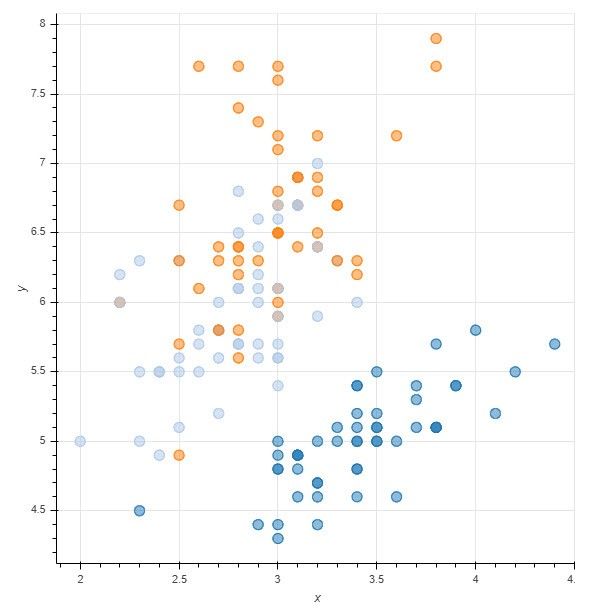
The scatter plot below, plotting flowers based on their sepal width (x) and sepal length (y), is relatively confusing, and no evident pattern is discernible, as the data associated with the four dimensions (sepal length, sepal width, petal length, and petal width) in the Iris dataset appears to be scattered all over the graph:
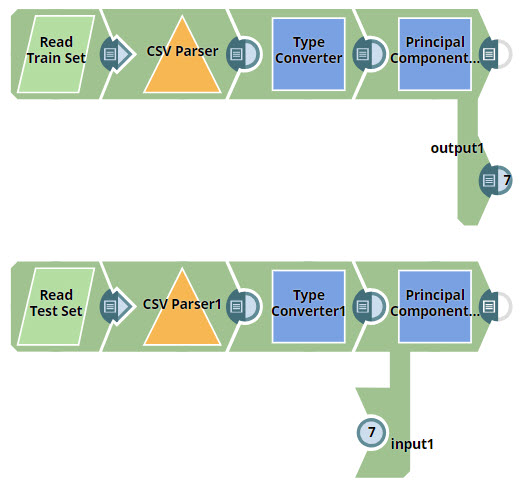
You design the pipeline to transform the input data to a two-dimensional view while retaining at least 95% of the variance:
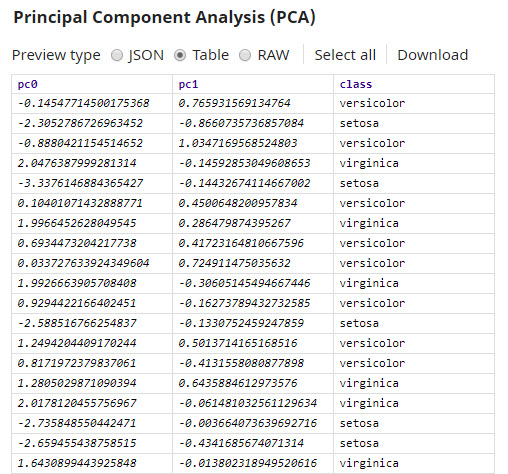
Once you apply PCA and reduce the number of dimensions to two, it becomes easier to see patterns in the representation:
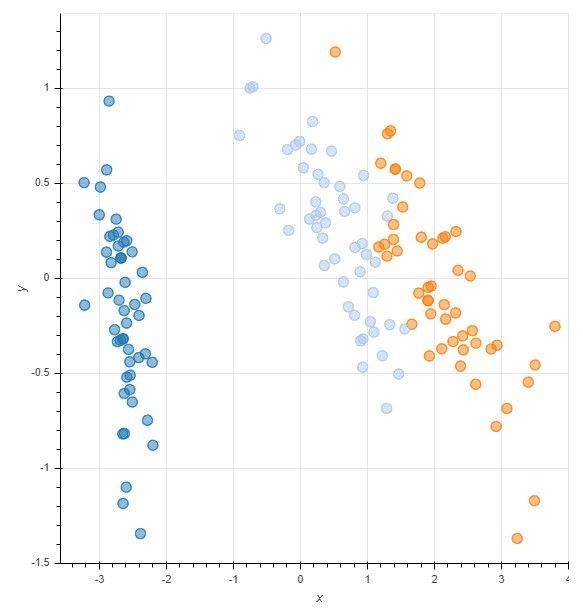
In this graph, the x axis represents the first principal component (pc0), and the y axis represents the second principal component (pc1). You can now see how the Setosa species, represented by the light blue dots in the graph, is very different from the other species of Iris flowers.
Download this pipeline.
| Expand | ||
|---|---|---|
| ||
In this pipeline, you perform the following tasks:
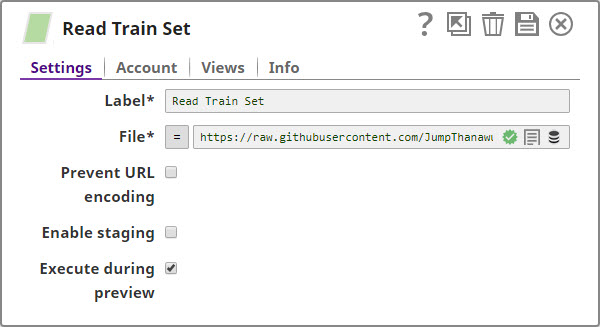
Key SnapsRead Train Set (Using the File Reader Snap)You configure the Read Train Set Snap to read data from here:
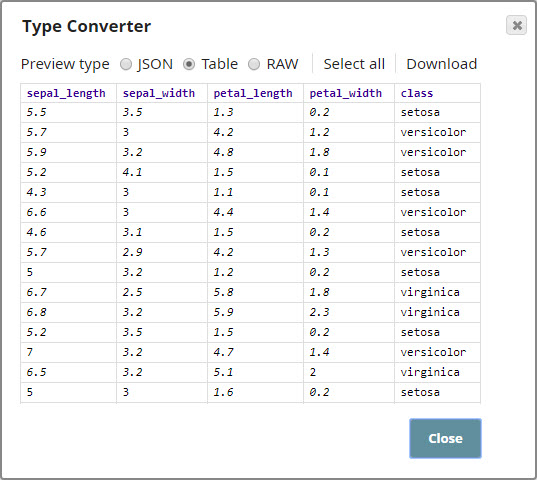
You now send the data to the CSV Parser and Type Converter Snaps, which you use with their default settings. The following image represents the output of the Type Converter Snap:
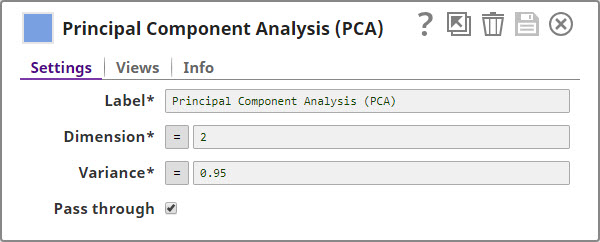
Principal Component AnalysisThis Snap only transforms numeric fields, and you configure it to reduce the number of dimensions to 2 while retaining 95% of the variance:
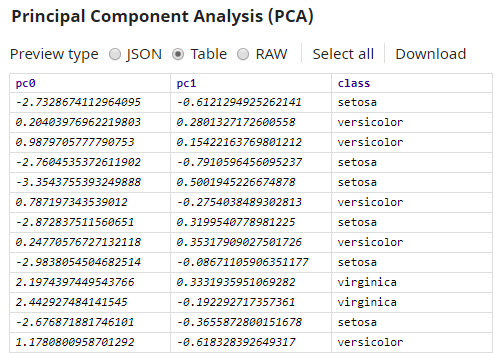
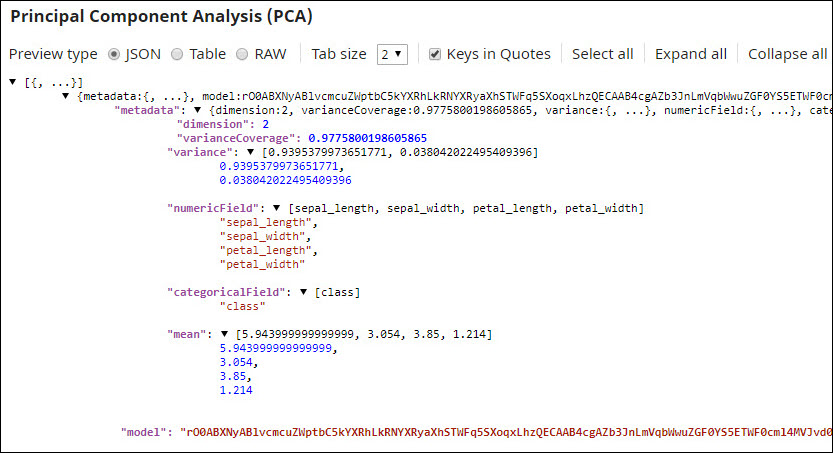
This Snap provides two pieces of output:
You run another set of data through the model that you got from the PCA Snap to see if the model works as expected. You find that indeed, the model works reliably, clustering flowers into two separate dimensions based on the length and width of their sepals and petals (See the graphs created before and after running the data through the PCA Snap, in the beginning of this example.)
Download this pipeline. |
Downloads
Multiexcerpt include macro name download_instructions page OpenAPI
| Attachments | ||
|---|---|---|
|
| Insert excerpt | ||||||
|---|---|---|---|---|---|---|
|