In this Page
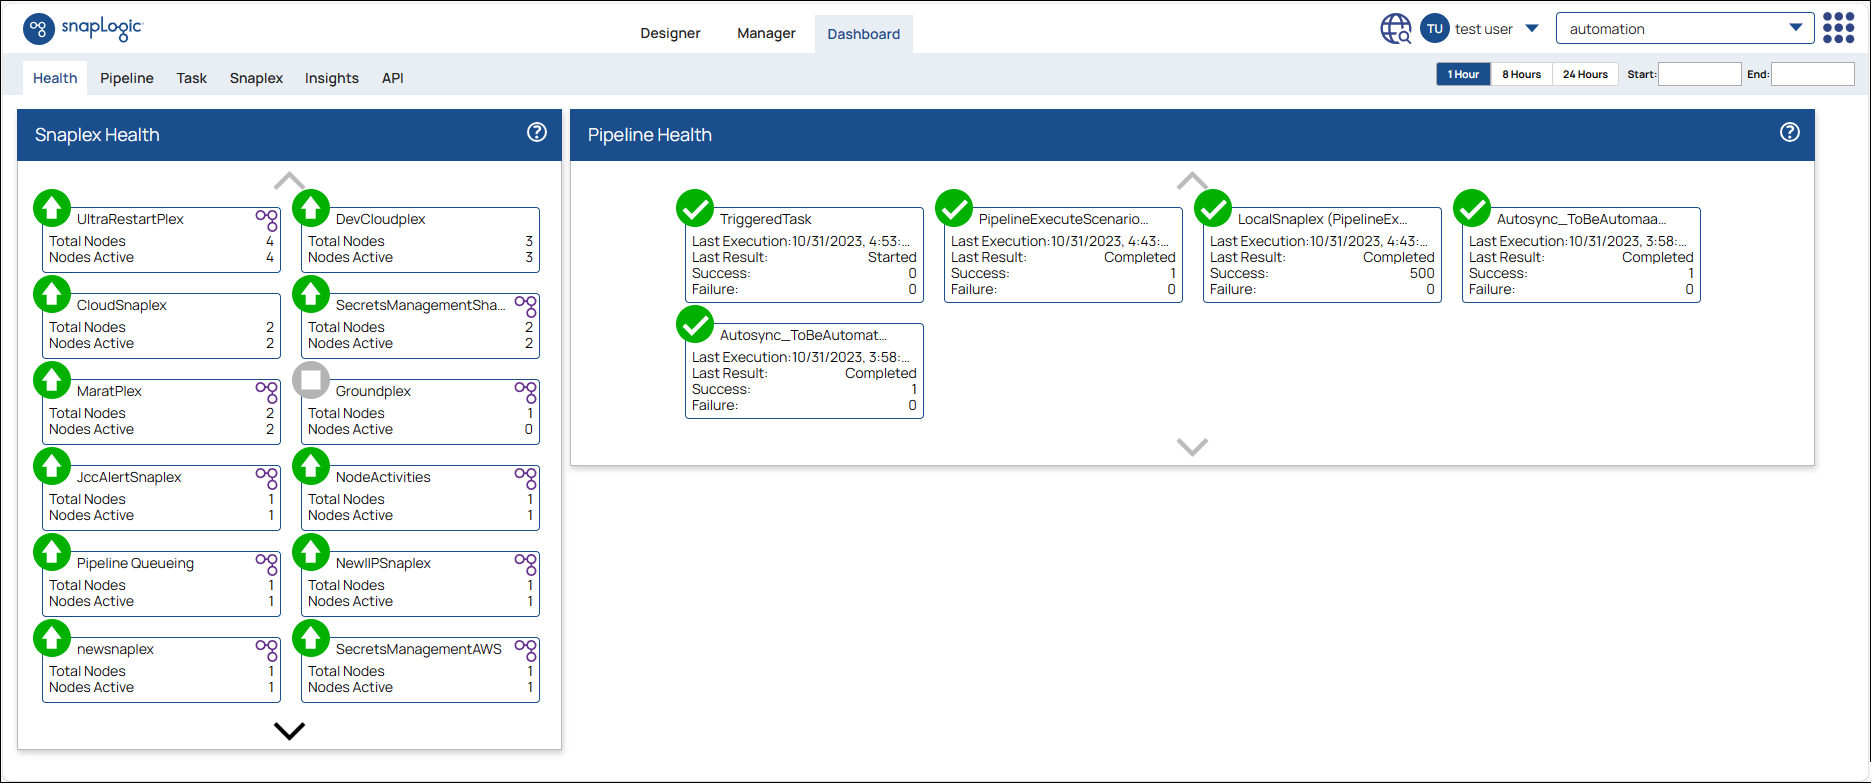
The Health wall displays information on the Snaplex instances available and the Pipeline run history.

Click inside the Snaplex Health panel to expand it:

In the Snaplex Health wall, the different icons indicate whether the Snaplexes and their individual nodes are up or down:
| Icon | Snaplex / node status |
|---|---|
| Up and running |
| Alert |
| Not running |
| Entering maintenance mode |
| In maintenance mode |
| Error status |
The following icon indicates the type of Snaplex:
| Icon | Type of Snaplex |
|---|---|
| Groundplex (Self-managed Snaplex) |
SnapLogic-managed Snaplexes (Cloudplexes) do not display an icon on the top right corner.
Some SnapLogic-managed Snaplexes in the EMEA region display the Groundplex icon because of their setup. |
The following icon indicates the node's role:
Icon | Node Role |
|---|---|
 | JCC node |
 | FeedMaster node |
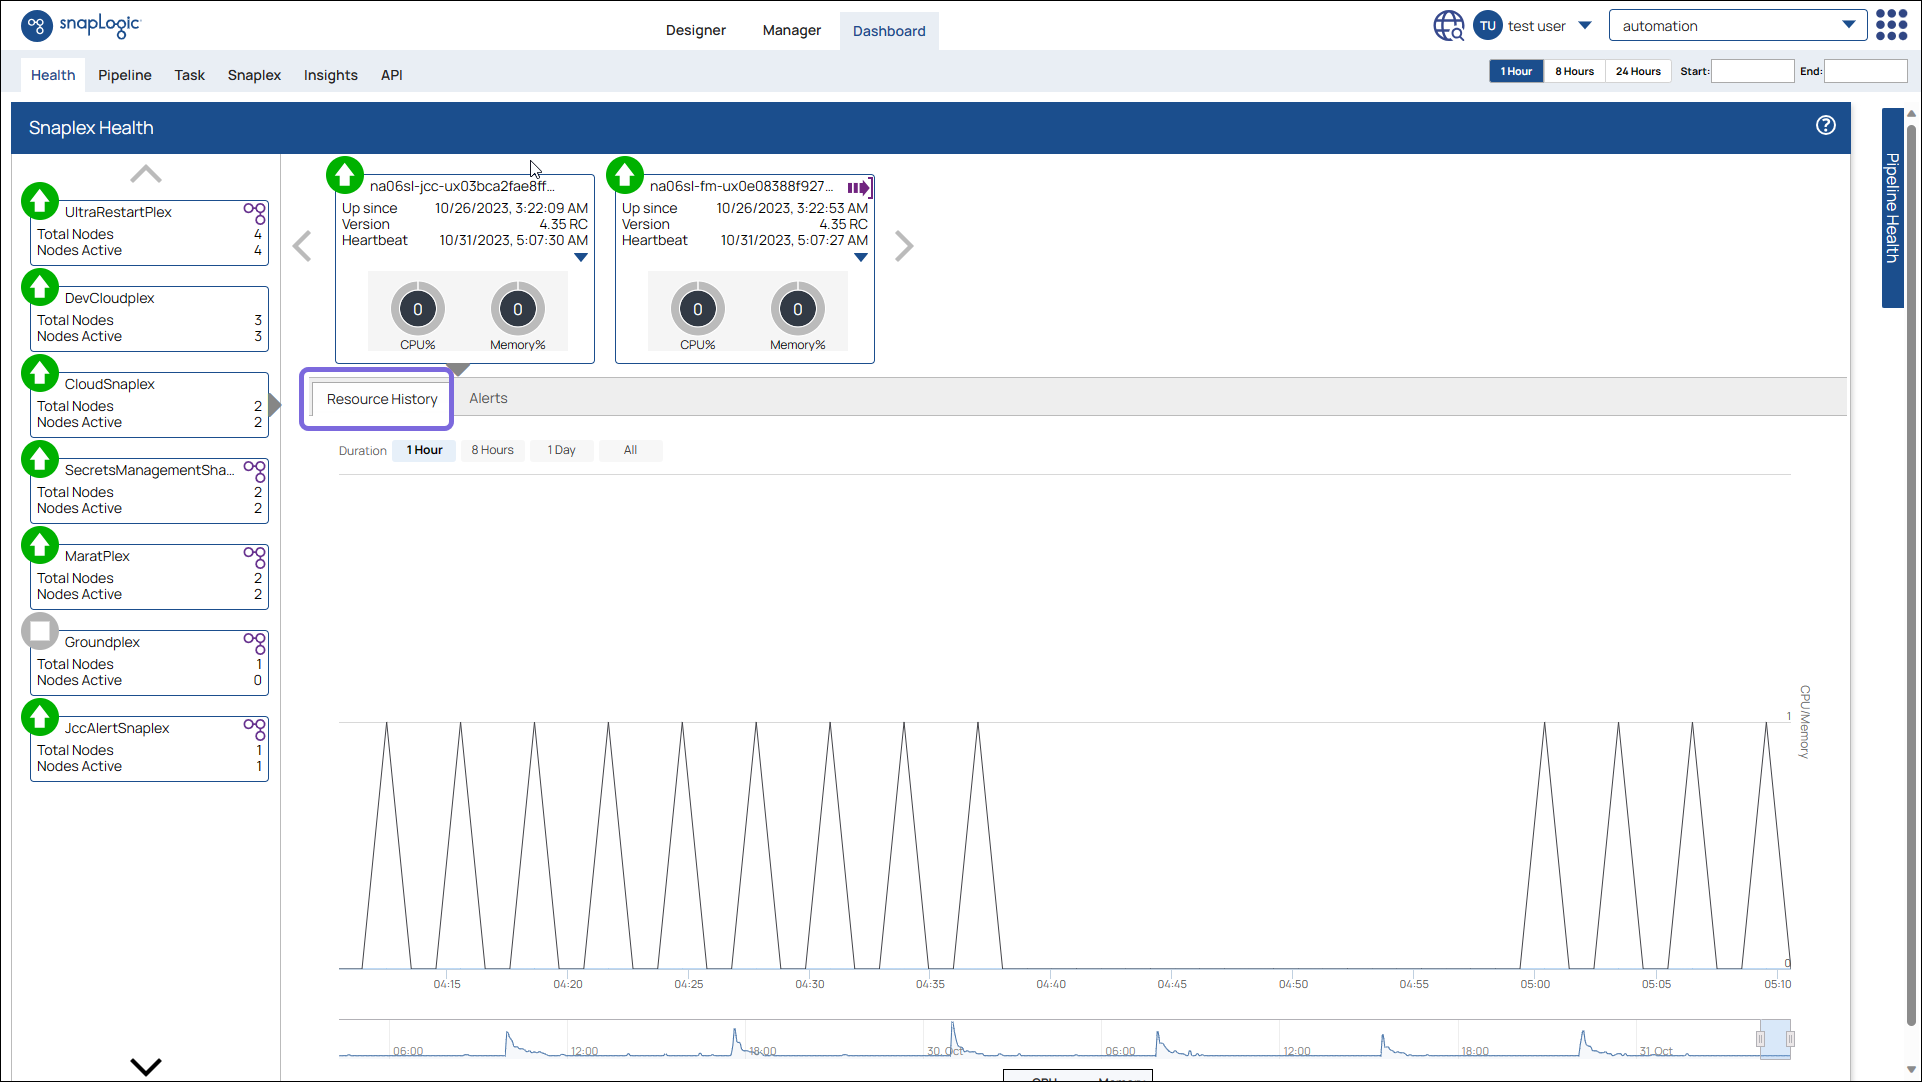
You can click on a Snaplex to view the following details on the JCC level:

A heartbeat is a periodic message sent by the Snaplex nodes to the SnapLogic Control Plane indicating the health of the node. The heartbeats are sent every 20 seconds and are used to troubleshoot node issues. |
Click the down arrow within the Snaplex dialog for additional node information and node restart option (available only to Org admins). The additional information includes:
Restarting nodes clears the cache for those nodes. We recommend that you do not restart your nodes while they are still in maintenance mode. |
You can also view the status (Recommended, Restricted, and Deprecated) of the Release and Build listed for Version:


For details about Snaplex versions, see Updating a Snaplex.
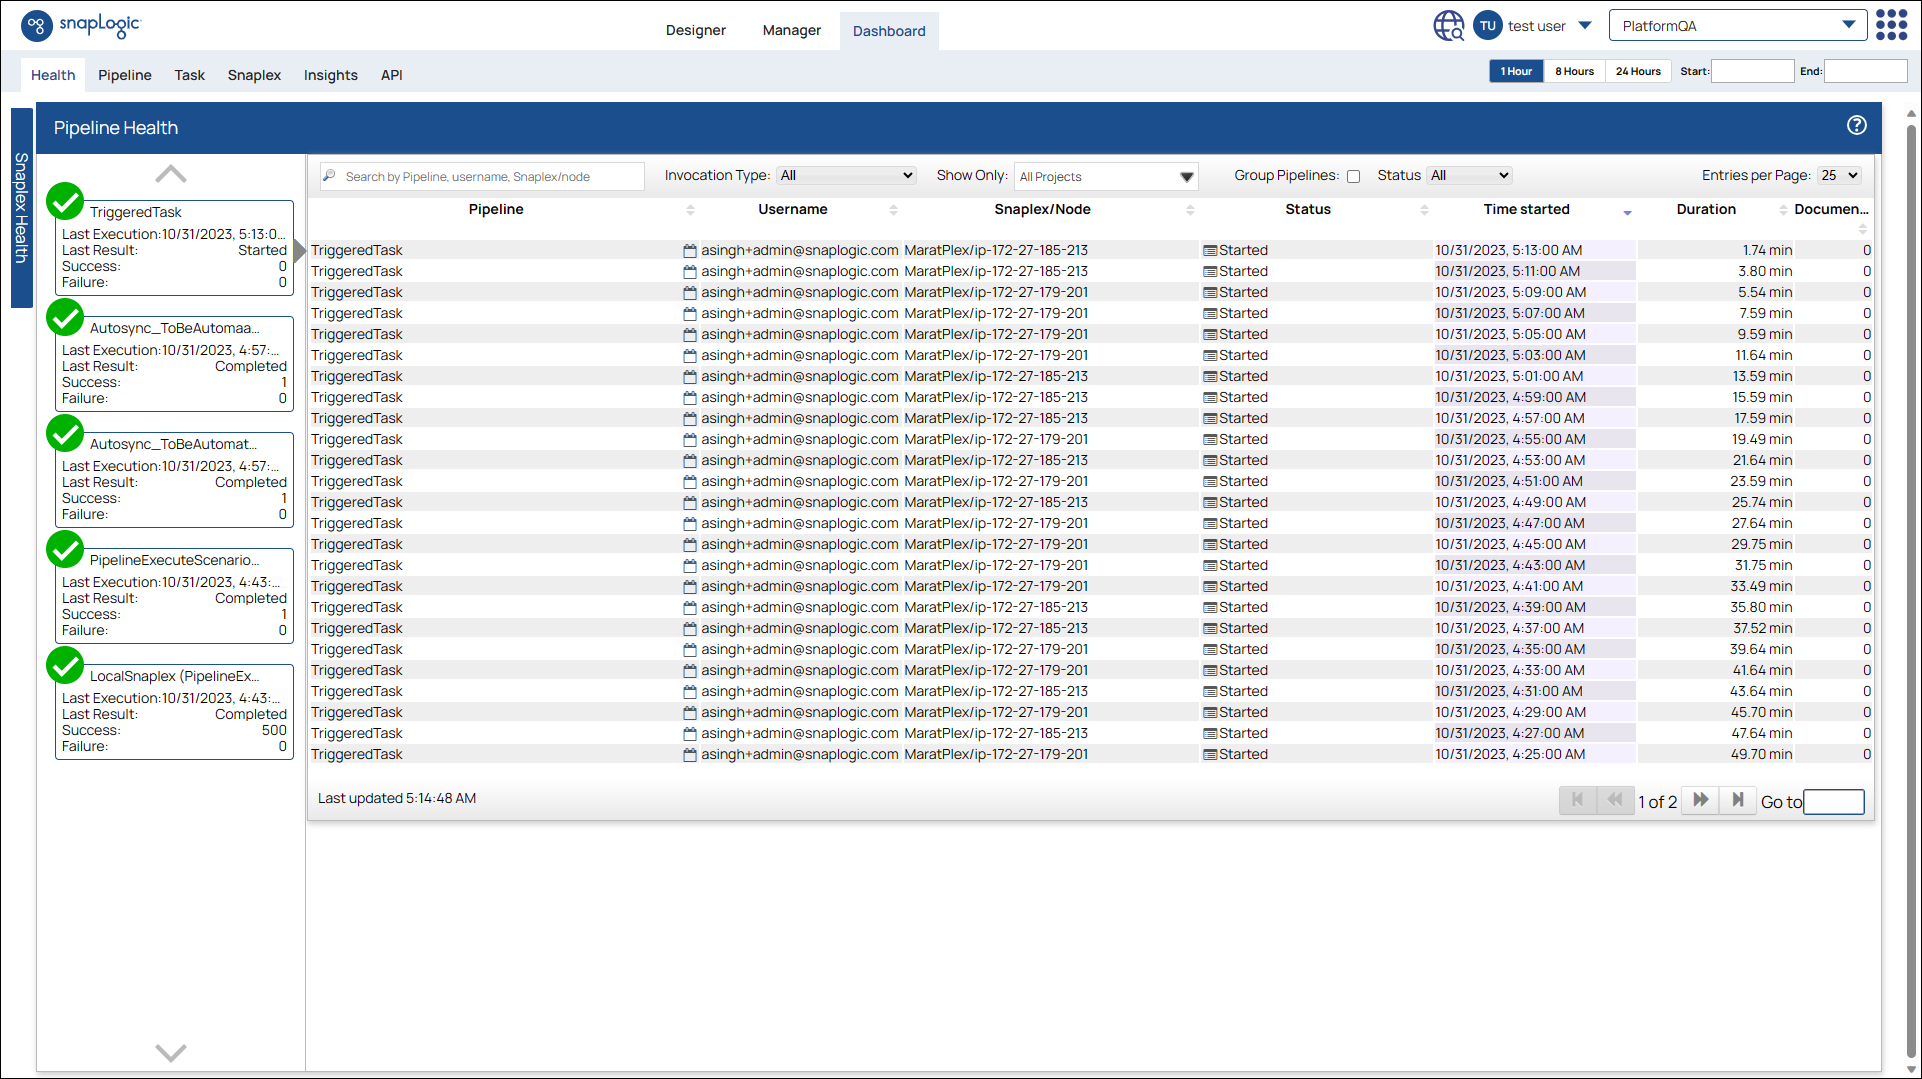
In the Pipeline Health wall, you can view the following information for individual Pipelines:
Click on an individual Pipeline to view the run history for that Pipeline:

To can stop a Pipeline, click the Pipeline tab, select the target Pipeline, then click ![]() .
.