On this Page
Clustering is the task of grouping a set of objects in such a way that objects in the same group are more similar to each other than to those in other groups. Clustering is a type of unsupervised learning. Unsupervised learning is a technique in which you can draw inferences from datasets consisting of data without labeled responses.
The Clustering Snap helps determine the intrinsic grouping among unlabeled numeric data. For example, discovering customer segments for marketing purposes, classifying different species of plants and animals, grouping books on the basis of topics and information, etc. If your data contains categorical fields, the Snap ignores all such fields.

Expected input
Expected output:
Expected upstream Snaps
Expected downstream Snaps: A Snap that accepts documents. For example, Mapper, JSON Formatter, or Sort.
|
None.
Accounts are not used with this Snap.
Input | This Snap has at most two document input views. |
|---|---|
| Output | This Snap has at most two document output views. |
| Error | This Snap has at most one document error view. |
None.
None.
| Label | Required. The name for the Snap. You can modify this to be specific, especially if you have more than one of the same Snap in your pipeline. | |
|---|---|---|
| Algorithm | Required. The clustering algorithm that must be used to cluster the data into specific groups. The available options are:
Default value: K-Means | |
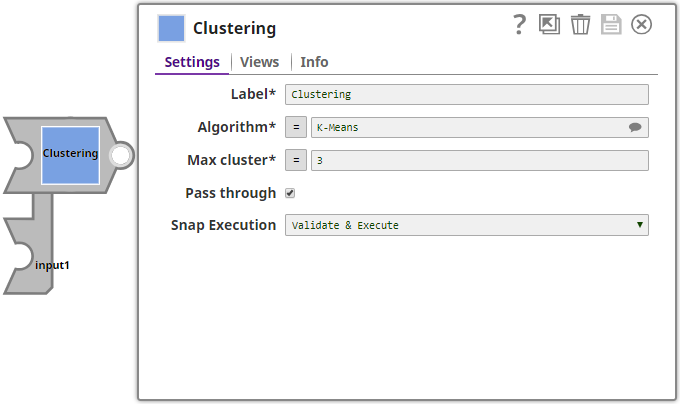
| Max cluster | Required. The maximum number of clusters that the Snap must create. Default value: 3 Minimum: 2 Maximum: 10000
| |
| Pass through | Select to include all input fields in the output. Else, the Snap outputs only the cluster index. Default value: Selected | |
| Snap Execution | The Snap execution mode. The available options are:
Default value: Validate & Execute |
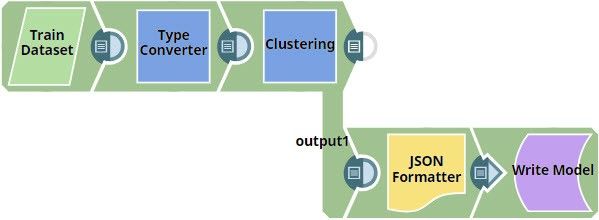
This Pipeline demonstrates how the Clustering Snap helps you cluster unlabeled data into groups using K-Means algorithm and save the model for later use.

Download this Pipeline.
In this example, the CSV Generator Snap named Train Dataset contains Iris flower samples and the length and width data of their sepals and petals. The Type Converter Snap is configured to automatically detect and convert the data types. In this example, all 4 fields: sepal_length, sepal_width, petal_length, and petal_width are automatically converted into numeric fields. The output preview of the Type Converter Snap is as follows:
This dataset is passed to the Clustering Snap which is configured as follows:
The Clustering Snap is configured as follows:
Because we have selected K-Means, the Snap will create exactly 3 clusters. We select Pass through to include all the input fields in the output. The Clustering Snap is configured for two output views. The first output view displays the data and the cluster index, and the second output view displays the model. The preview from the first output view of the Clustering Snap is as follows:
The dataset is grouped into 3 clusters as seen in the $pred column. The Clustering Snap computes the differences in each pair of the documents and groups the most similar ones into the same cluster. Each algorithm has a way to cluster documents differently. This clustering is for the K-Means algorithm. The preview from the second output view of the Clustering Snap is as follows:
In the output preview, we can view the model. The model output of the Clustering Snap is converted to JSON using the JSON Formatter Snap and then passed to a File Writer Snap. This model can then be used in another Pipeline with Clustering Snap to derive predictions. |