Monitoring your Snaplexes in a Kubernetes Environment
In this Article
Overview
In a Kubernetes environment, application admins must ensure that there are sufficient resources for their users. Support for elastic scaling provides the capability to scale resources up or down depending on the impact on CPU and memory. The scaling happens automatically and is based on Horizontal Pod Autoscaling (HPA). In this article, we describe a basic scenario that explains how you can observe the scaling of resources in your Kubernetes environment.
Resource Scale Up
Additional resources are needed when a Pipeline processes documents at a high volume or too many Pipelines are running at the same time.
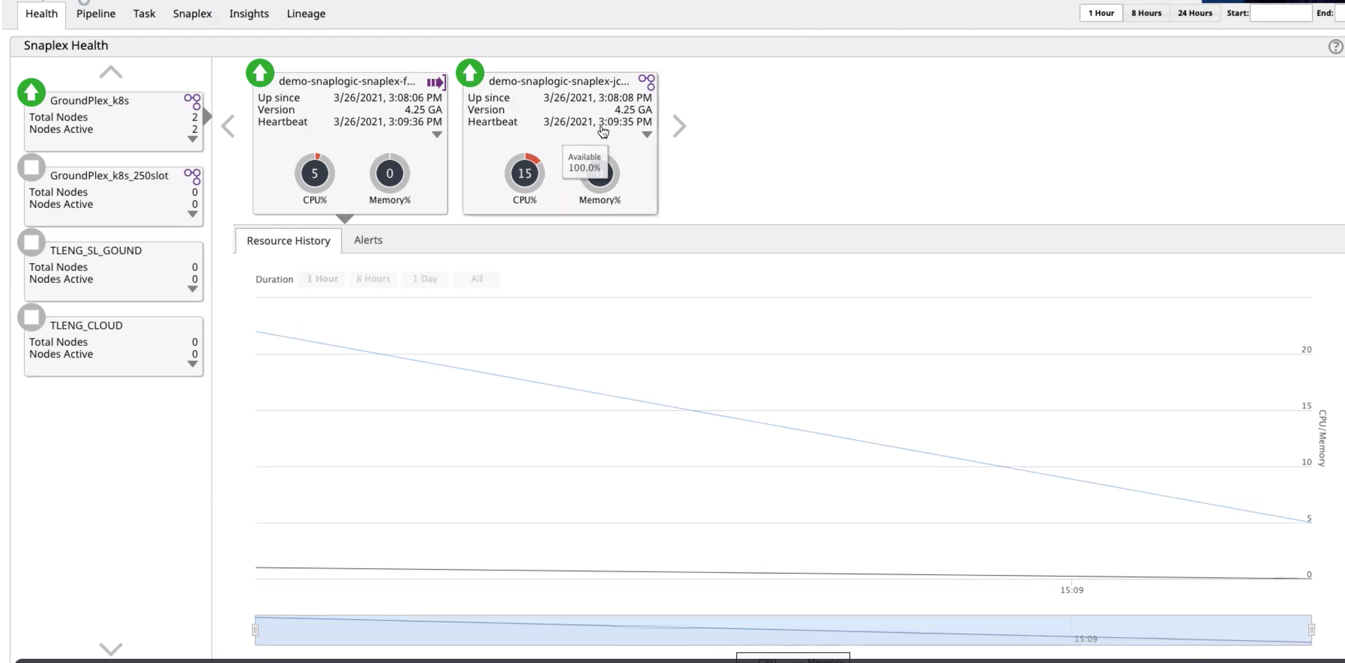
In this scenario, we have a Snaplex and FeedMaster set up in our Kubernetes environment.
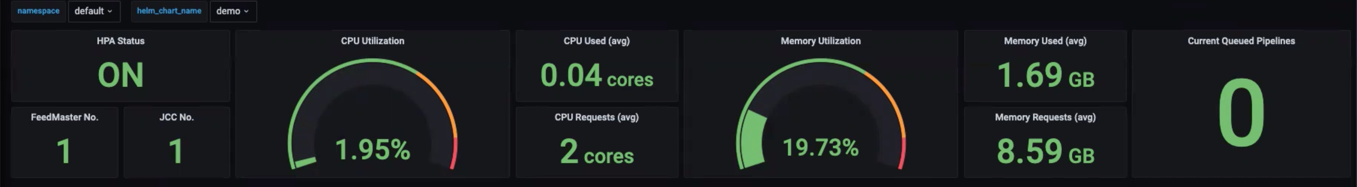
The following image from the SnapLogic dashboard in Grafana shows a light load on the CPU and Memory.
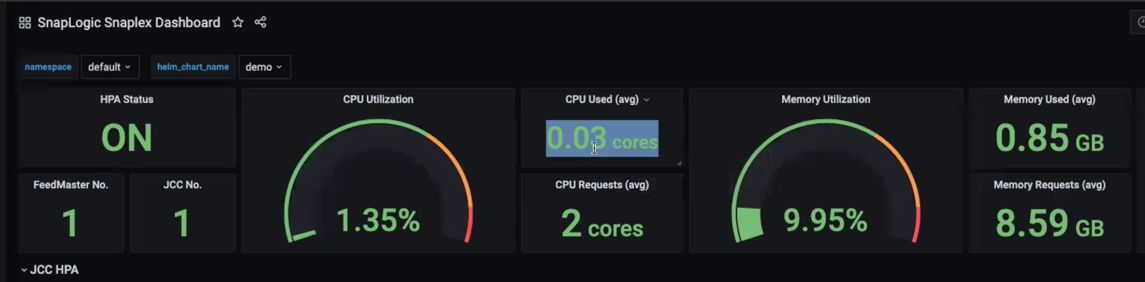
In the graph, the color coding for the lines in the chart lines indicates the following:
- Green—Zone of Average CPU Usage
- Red—Requested CPU Resources
- Orange—Zone of HPA Metric Threshold (see other charts in this article)
The Requested CPU Resources is a hard threshold, while the HPA Metric Threshold is the threshold that determines the scale up of resources.
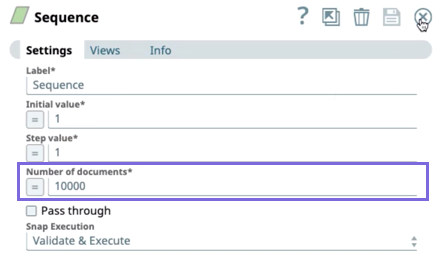
Next, we run a Pipeline that generates the data spike resulting in resource scaling based on the CPU utilization metrics entered in the Helm Chart. The Pipeline is a basic construct: a Sequence Snap plus a Pipeline Execute Snap. The following image shows the Sequence Snap configured to process a 10,000 documents.
The Pipeline uses the Pipe Execute Snap to call the child Pipelines to process those records. Importantly, we configure this Snap to run those child Pipelines on the local Snaplex to enable the automatic scaling of resources, as shown in the following image.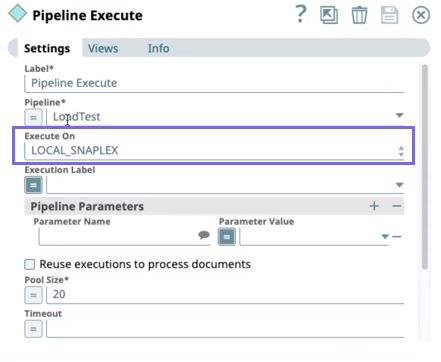
Were another Snaplex option selected (like Local_Node), then only that one Snaplex node would be dedicated to running the Pipeline, and the support for elastic scaling would not apply.
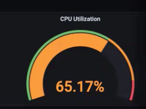
Once the Pipeline execution starts, the load on the CPU increases.
When we observe the execution statistics of the Pipeline, we observe the high volume processing of documents.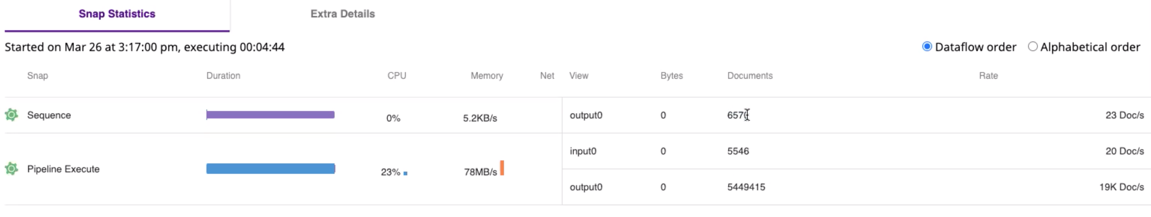
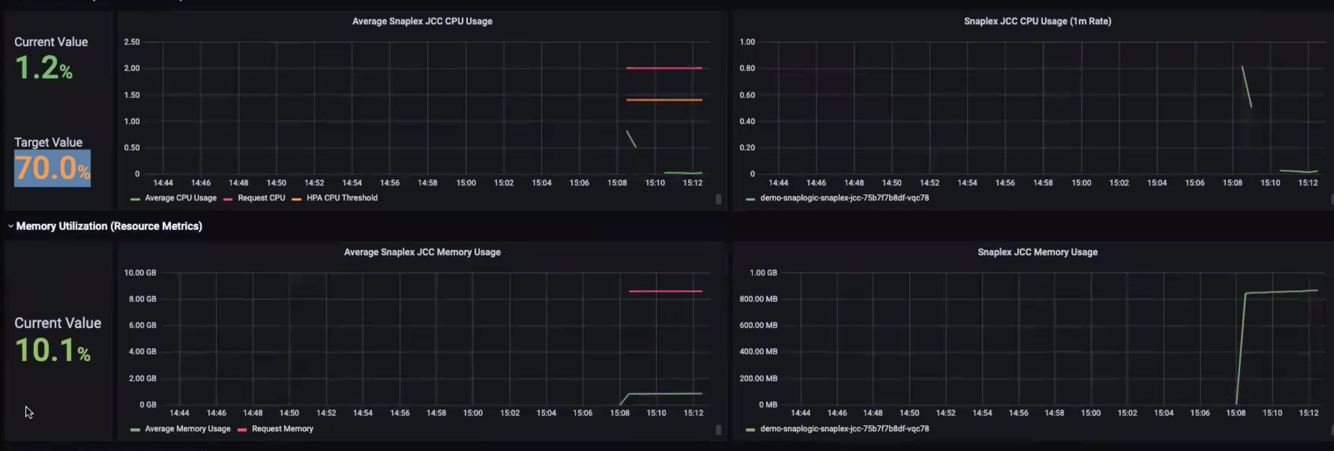
We view the rapid increase of resource CPU utilization in Grafana. The amount of CPU processing power increases up to nearly the point set in the Helm Chart.
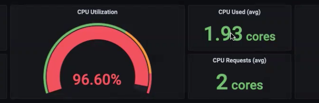
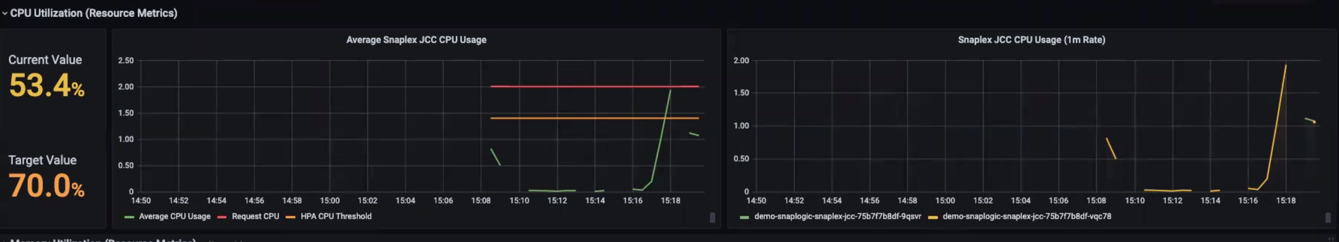
We see that the Average CPU Usage has violated the HPA CPU Threshold, and therefore more resources are scaled up as the usage reaches the Request CPU metric.
Resources Scale Down
Using the same Pipeline, we can observe the scale down of resources in our Kubernetes environment. When our Pipeline nears completion, the resources in Kubernetes scale down as they are no longer required.
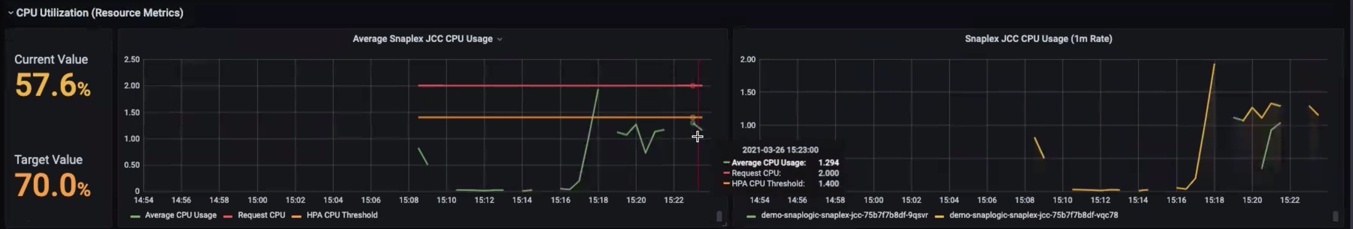
We can observe that the Average CPU Usage begins to dip below the HPA CPU Threshold. As resource utilization decreases, the CPU cores used scale down.
Have feedback? Email documentation@snaplogic.com | Ask a question in the SnapLogic Community
© 2017-2024 SnapLogic, Inc.