"Sentient" Web Application Creation
Overview
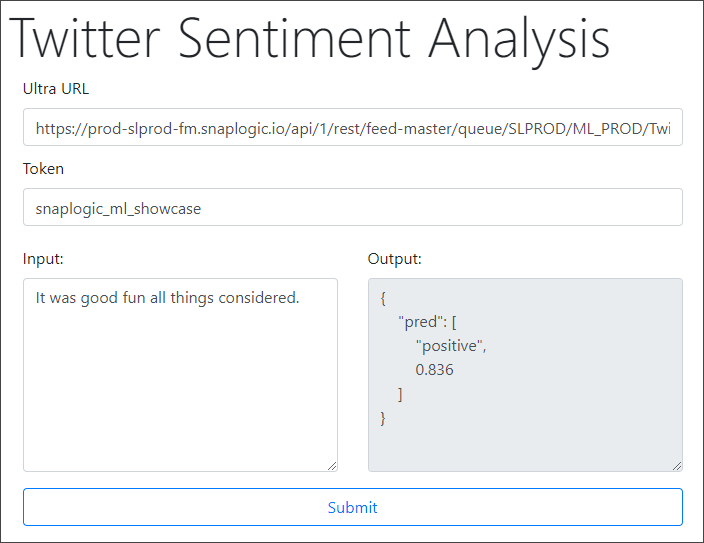
This use case demonstrates how you can use SnapLogic Data Science to create "sentient" web applications, which can perform sentiment analysis and computationally identify and classify opinions expressed in a piece of text. For example, consider the following screenshot from a demo on our SnapLogic Machine Learning Showcase, created using SnapLogic Data Science. This application takes a sentence as input, analyzes it, and predicts whether the sentence is positive or negative in sentiment.
This document explains how you can use the SnapLogic platform to build and deploy this application, and is structured as follows:
- High-level architecture and information flow: Offers a high-level view of the flow of tasks in the application.
- Key components: Lists and describes the key components that you need for the application.
- Building the application: Explains how you can create each of the key components that make up the application.
Understanding the Twitter Sentiment Analysis Application
This section offers basic information on the following:
- High-level architecture of the application
- Information flow of the application
High-Level Architecture
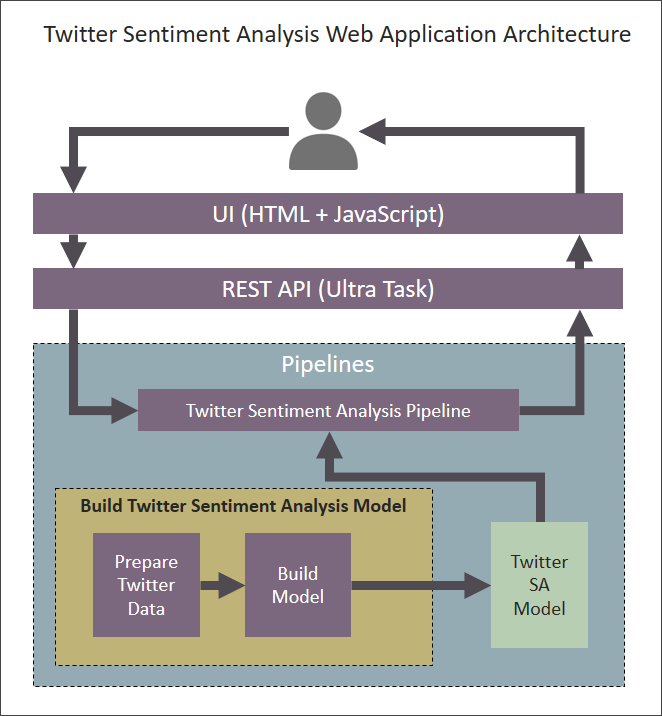
The Twitter Sentiment Analysis web application is structured as follows:
Information Flow of the Application
This architecture enables the following functionality:
- The user triggers the application by providing an input sentence.
- The UI (HTML + JavaScript) calls a REST API, which points to an Ultra Task.
- The Ultra Task sends the input sentence to the Twitter Sentiment Analysis Pipeline.
- The Twitter Sentiment Analysis Pipeline uses the Twitter Sentiment Analysis model built using SnapLogic Data Science to determine the polarity of the input sentence and send it back to the UI.
- The Twitter Sentiment Analysis model is built using two Pipelines:
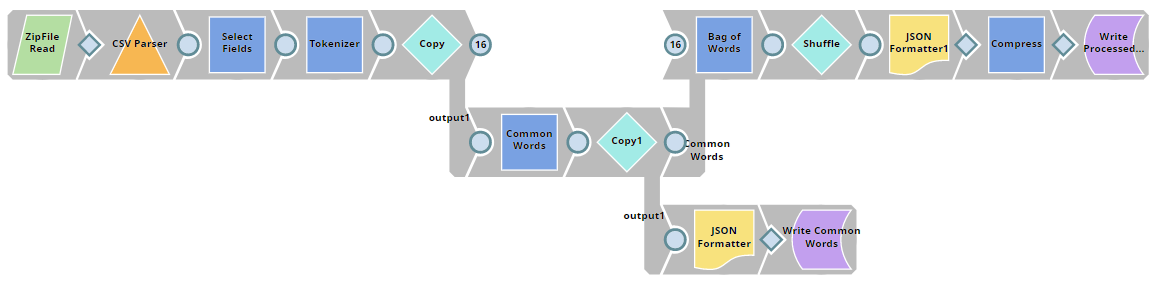
- The Prepare Twitter Data Pipeline uses the sentiment140 dataset as a source of input sentences and applies Bag of Words techniques to prepare the dataset, which can be used to train the model.
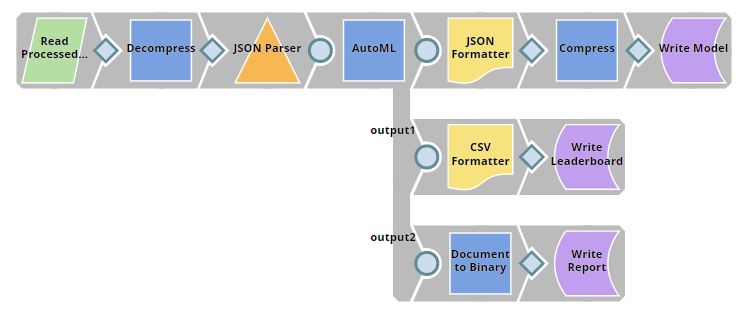
- The Build Model Pipeline uses the processed dataset to create (and save in the SnapLogic File System (SLFS)) a model using a range of machine learning algorithms. For details on these algorithms, see the Build Model Pipeline section below.
Key Components of the Application
To create the Twitter Sentiment Analysis web application, you will need to create the following artifacts:
- The Twitter Dataset
- The Twitter Sentiment Analysis Pipeline and Model
- The Twitter Sentiment Analysis Ultra Task
- The UI (HTML + JavaScript)
This section describes how you can create each of these.
The Twitter Dataset
For this use case, we use the sentiment140 dataset. It contains 1,600,000 tweets extracted using the Twitter API. The tweets have been annotated (0 = negative, 4 = positive) and they can be used to train the model to detect sentiment.
The Twitter Sentiment Analysis Pipeline and Model
This section offers a high-level view of the Pipelines used in Twitter Sentiment Analysis. For detailed information on the contents of each Pipeline, see Understanding Twitter Sentiment Analysis Pipelines.
You create the following Pipelines:
| Pipeline | Description |
|---|---|
| Data Preparation
|
| Build Model
|
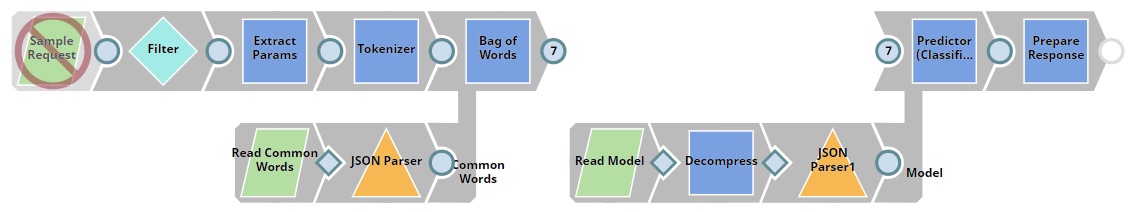
| Twitter Sentiment Analysis
The Sample Request Snap is disabled since this pipeline is scheduled as Ultra Task to provide API to external application so the data will come from the API call. This Snap contains a sample request for testing purpose, you can enable the Snap and validate the pipeline to see the result. |
The Twitter Sentiment Analysis Ultra Task
The Ultra Task functions as an API to the Twitter Sentiment Analysis HTML web application, which calls the API using a URL like the following:
If you do not already have an Ultra Task, perform the following steps to create one:
- Download and configure the Pipelines as discussed in the previous section. If you have already done so, you can skip the following two steps.
- Download the Twitter Sentiment Analysis.zip file. This file is an export of a project containing the required Pipelines, tasks, and files.
- Import the project. In SnapLogic Manager, select the project space > Import. For more information, see How to Import and Export Projects.
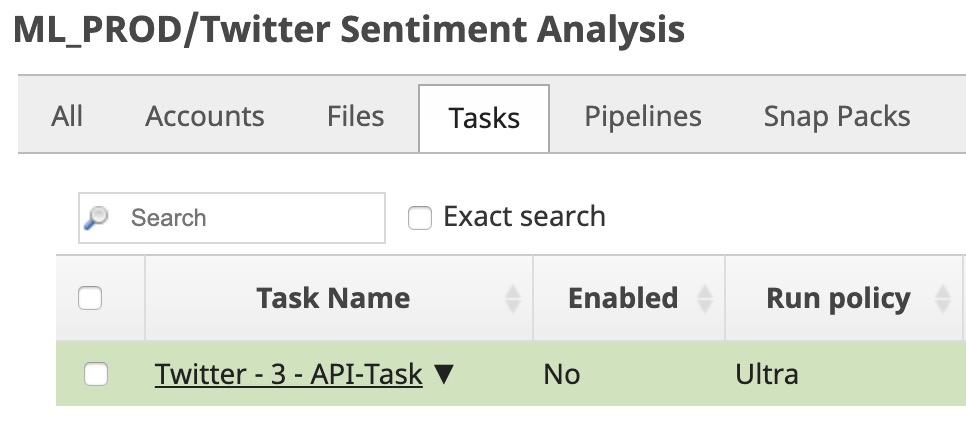
- Go to the project that you created in Manager and click the Tasks tab. Click the task entity in the list of files to open the Update Task dialog.
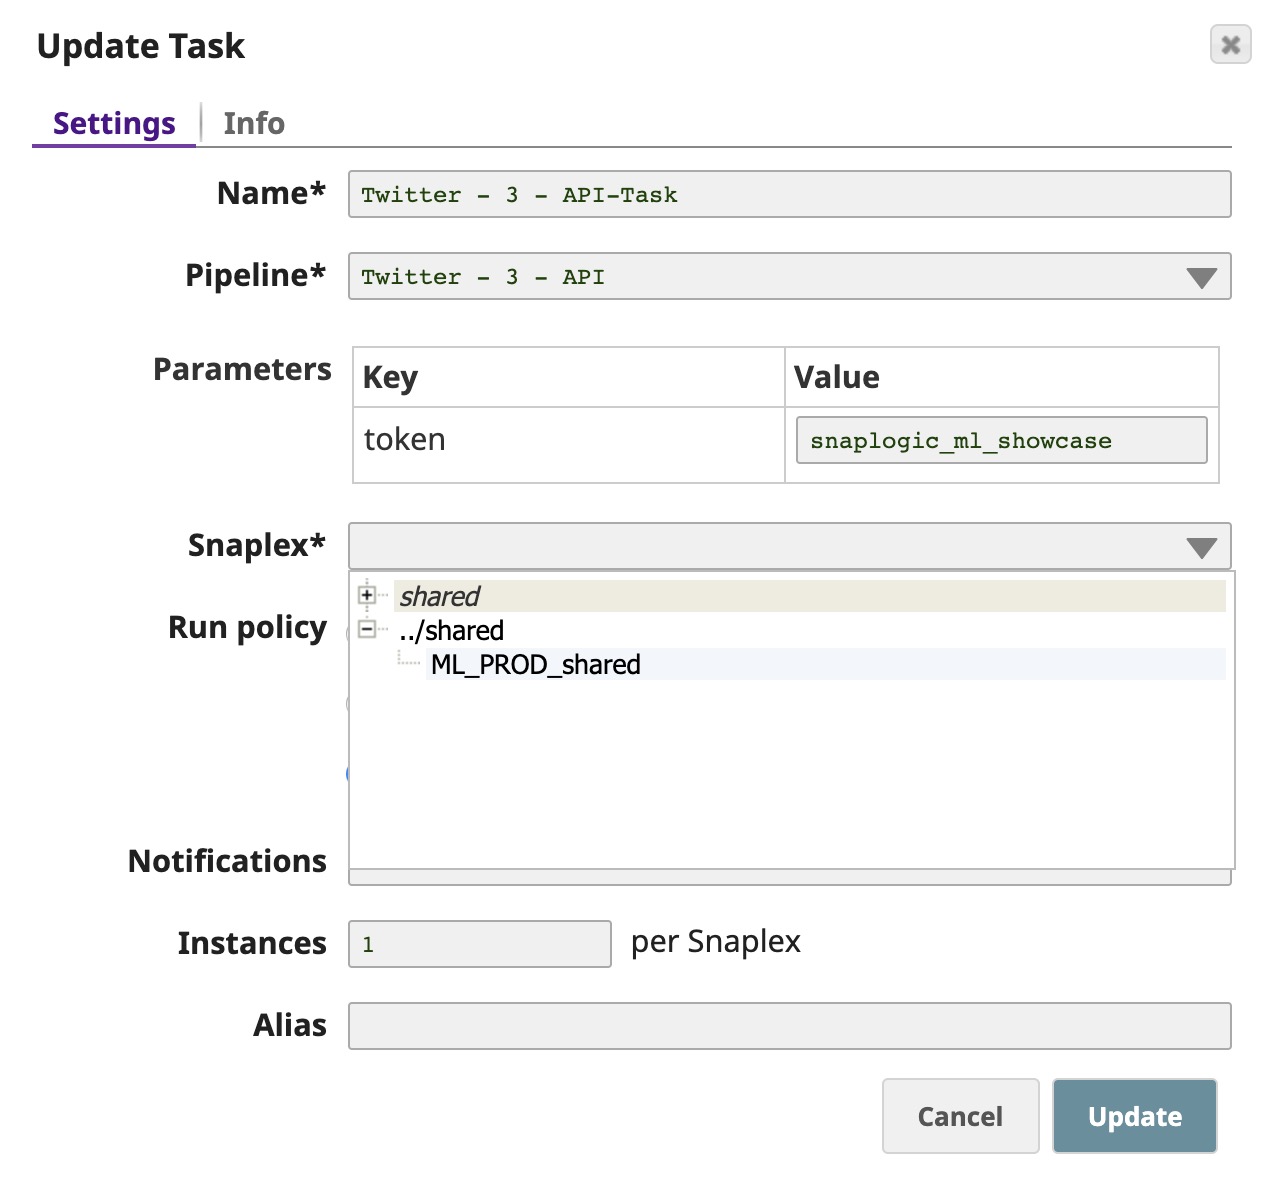
Select the Snaplex on which you want to deploy this Ultra Task. Click Update.
This updates the task and redisplays the list of files associated with the project.The FeedMaster node is required for scheduling Pipelines as Ultra Tasks.
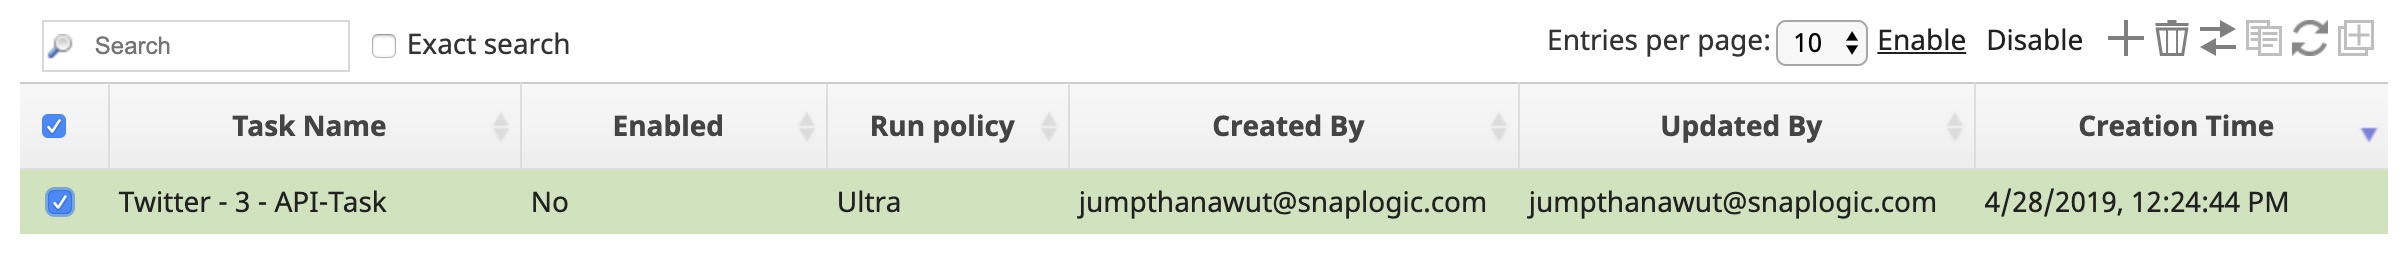
- Your Ultra Task is now created and can be used once it is enabled. To enable the task, select the check box associated with the task and click Enable on the top-right section of the screen.
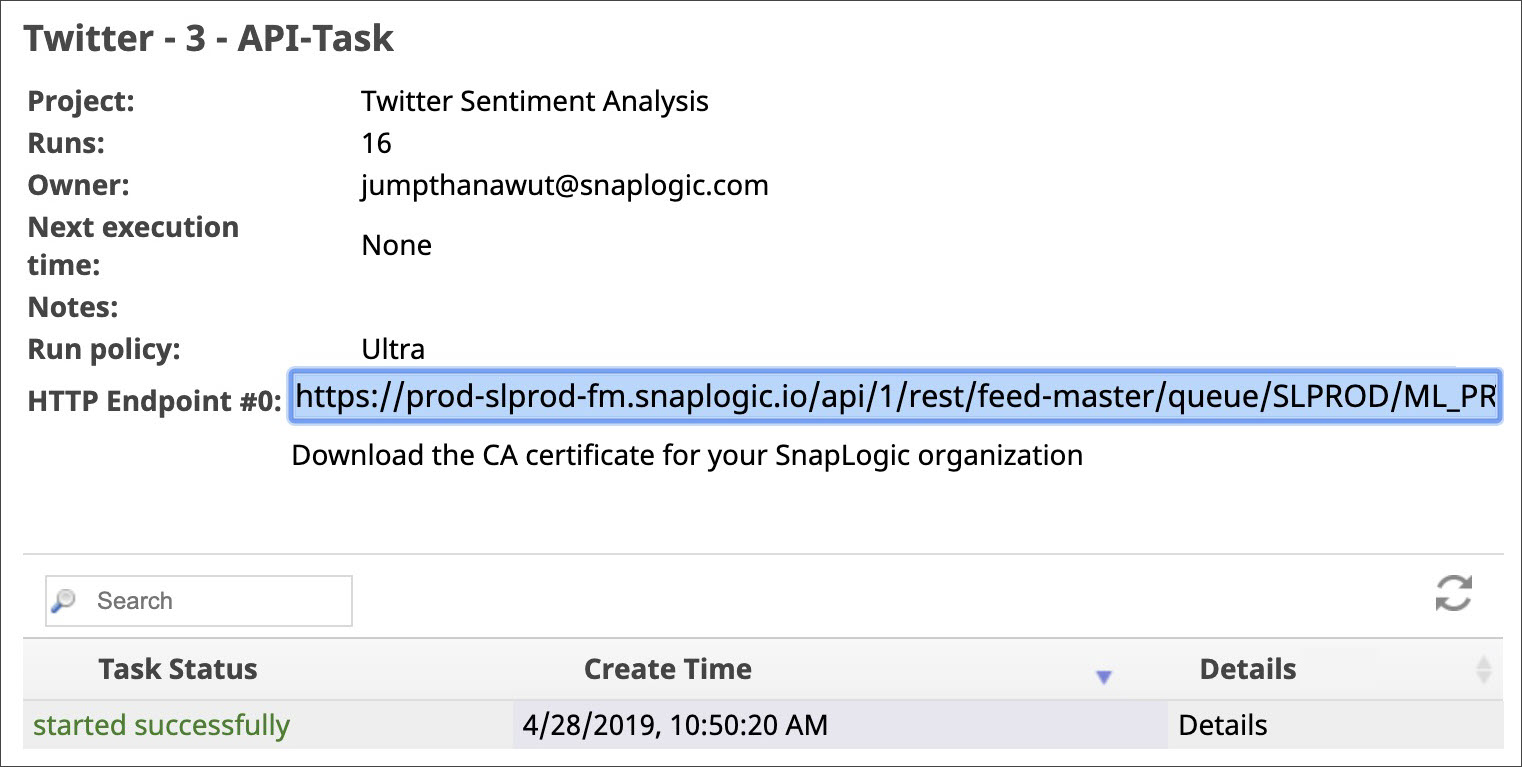
- You now need to copy the URL to this task, so you can use it with the web application. Click the inverted triangle next to the Task's name and click Details to open the Task details pane.

- In the Task details page, copy the URL listed in the HTTP Endpoint field and save it on your local machine to add it later on to your HTML file. Tasks can take up to 5 minutes to start. At any time, you can click the Details option to view the Task's status.
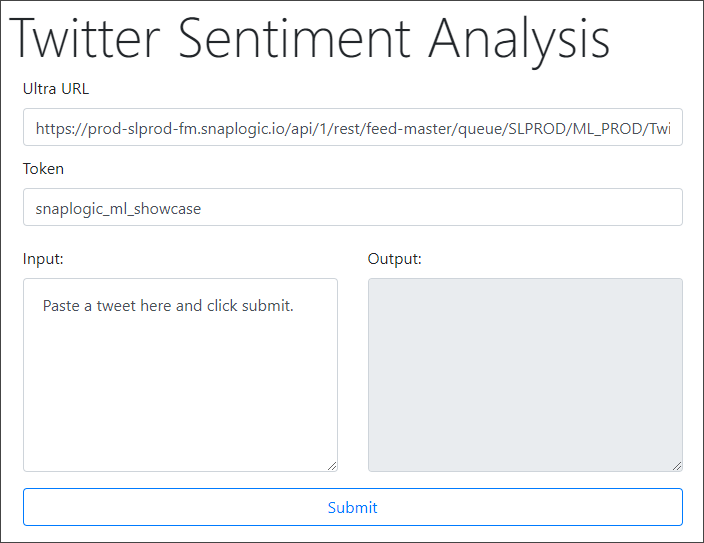
The UI (HTML + JavaScript)
This is an HTML page with a simple form containing the following key elements:
- Ultra URL: Lists the URL to the Ultra Task associated with the application.
- Token: Lists the token that you want to use to pass the input string to the Ultra Task API.
- Input: Contains the input string whose polarity you want to evaluate.
- Output: Displays the sentiment analysis of the input string.
For information on how the HTML file is coded, see Creating and Deploying the Twitter Sentiment Analysis Front-end. The page also contains information on how you can modify the HTML file before you deploy it.
Putting it All Together: Running the Web Application
Once your Pipelines, API, and UI are in place, run the application to check whether everything is working as expected. To run the application, simple open the HTML file using the web browser:
- Navigate to the URL where you deployed your web application. If you made no changes to the UI, the web page must display as shown below:
- Enter a sentence in the Input text area on the left and click Submit.
The web application now sends the request to the API you created earlier, which, in turn, runs your input sentence through the Pipeline described above. Once the result is ready, it is displayed in the Output text area on the right:
Have feedback? Email documentation@snaplogic.com | Ask a question in the SnapLogic Community
© 2017-2024 SnapLogic, Inc.