...
Callout | Element | Description | ||
1 | 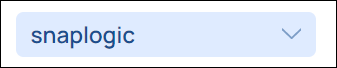 | Admins and users with accounts on multiple Orgs can use this pull-down to switch between Orgs. | ||
2 |  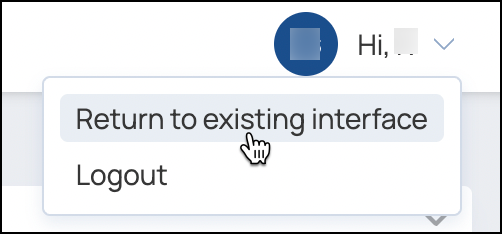 | Use the dropdown by your name to return to the existing interface or logout. | ||
3 | 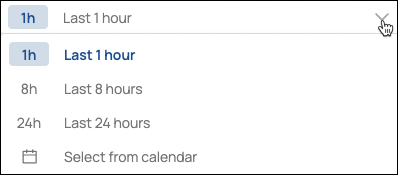 | Use the dropdown menu to filter the executions displayed in the table by hour periods or a by a date range. | ||
4 | 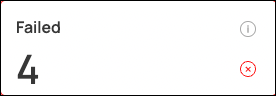 | Execution summary cards display the number of Pipeline and Task executions by status:
| ||
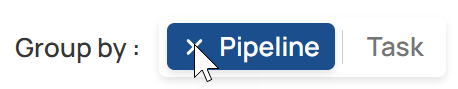
5 | 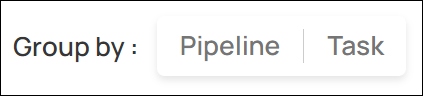 | Group by options filter the executions shown in the table by Pipeline or Task:
| ||
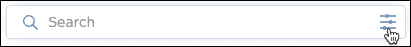
6 | 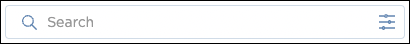 | Search the execution list, click the options icon to:
| ||
7 | 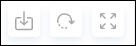 | From left to right, table toolbar buttons provide the following functionality:
| ||
8 | 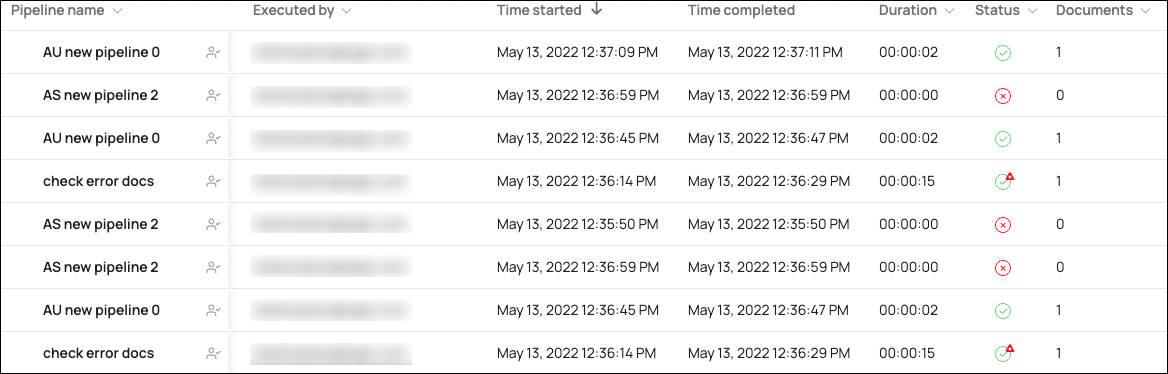 | View and manage the list of executions:
| ||
9 |  | Expand or collapse navigation panel. | ||
10 |  | Page through executions and select how many to show per page. |

...
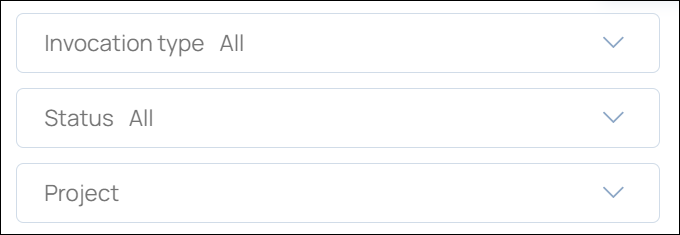
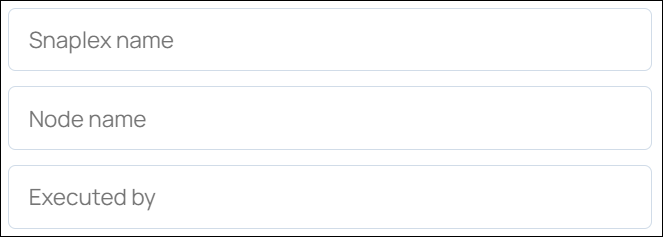
In the Search bar, click the options icon:

In Advanced filtering, click the type of filter to apply.
The first filters in the menu have pull-down options:
The final filters in the menu accept text entries:
Add the filters you need and click Apply.
...
In the Search bar, click the options icon:
In Column Preferences:
Click x on a shaded column to remove it.
Click + on an unshaded column to add it.
Drag shaded columns to rearrange the order in which they display in the table.
Click Apply.
...
In the Search bar, click the options icon:
In Advanced Options, click Executed by and start entering your username.
When your username displays, click + to select it.
Click Apply.
...