On this page:
Analyze Pipeline and Task Execution
The Execution overview page displays a list of Pipeline and Task executions. You can see who executed them, when they started and finished, how long execution took, their status, and how many documents were processed. Using controls on the Execution overview page, you can:
Select a time period in hours or by date range.
View status summary cards for the selected time period.
Filter the execution table by status.
Click a Pipeline or Task to view its details. Learn more about Execution details.
Search, filter, and add or remove columns from the execution table.
Export the current results to a CSV file.
Refresh the execution table.
Sort the execution table by a column.
In SnapLogic Studio, click Analyze > Execution to open the Execution overview:
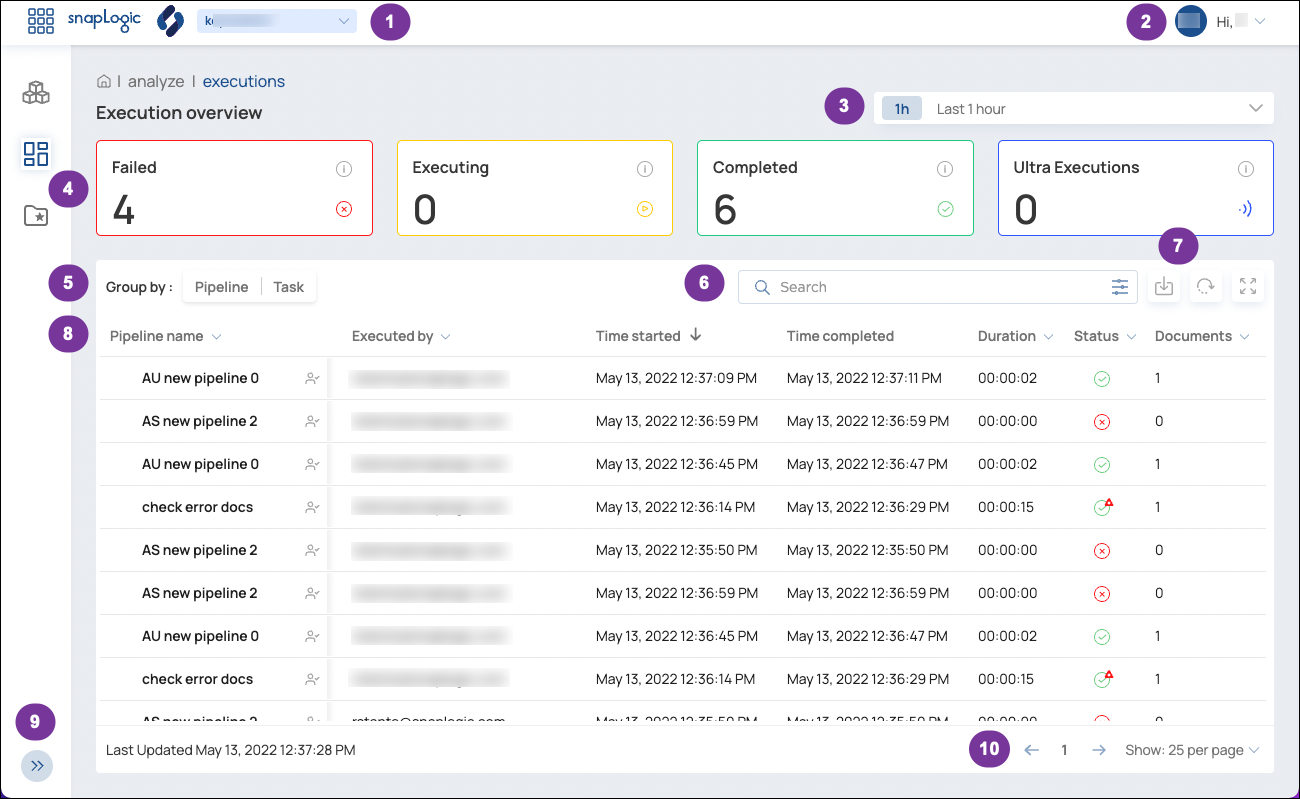
The Execution overview page contains the following elements and controls, starting at the top left side of the screen:
Callout | Element | Description |
1 |  | Admins and users with accounts on multiple Orgs can use this pull-down to switch between Orgs. |
2 | 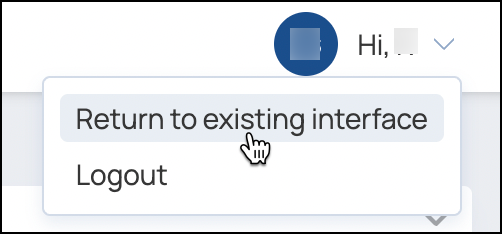 | Use the dropdown by your name to return to the existing interface or logout. |
3 | 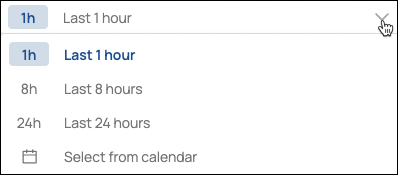 | Use the dropdown menu to filter the executions displayed in the table by hour periods or a by a date range. |
4 | 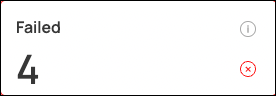 | Execution summary cards display the number of Pipeline and Task executions by status:
Tips:
|
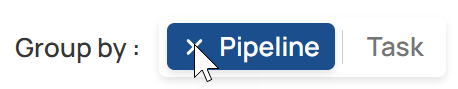
5 | 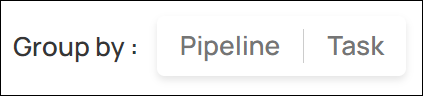 | Group by options filter the executions shown in the table by Pipeline or Task:
|
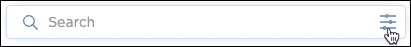
6 | 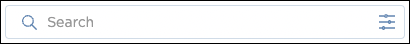 | Search the execution list, click the options icon to:
|
7 | 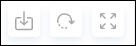 | From left to right, table toolbar buttons provide the following functionality:
|
8 | 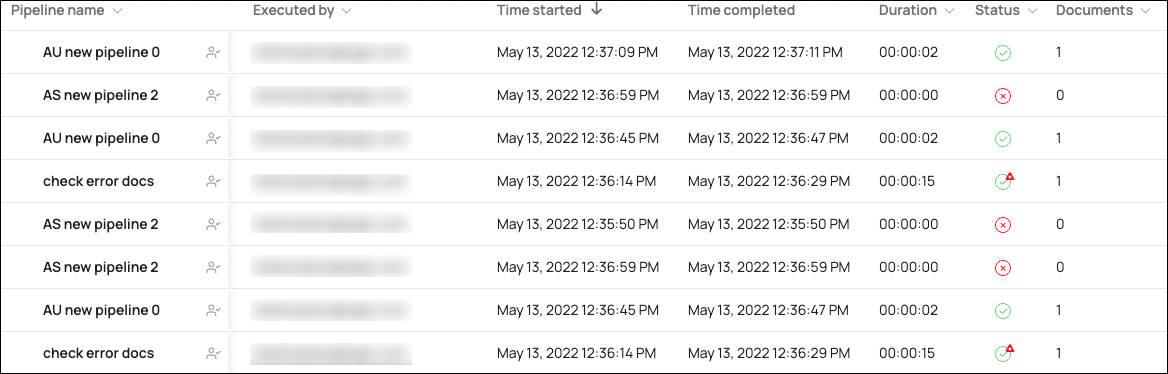 | View and manage the list of executions:
Tips:
|
9 |  | Expand or collapse navigation panel. |
10 |  | Page through executions and select how many to show per page. |

Use Cases
The following examples describe how to use the Execution overview page for troubleshooting and analysis:
Using Advanced Filters
To use advanced filtering:
In the Search bar, click the options icon:
In Advanced filtering, click the type of filter to apply.
The first filters in the menu have pull-down options:
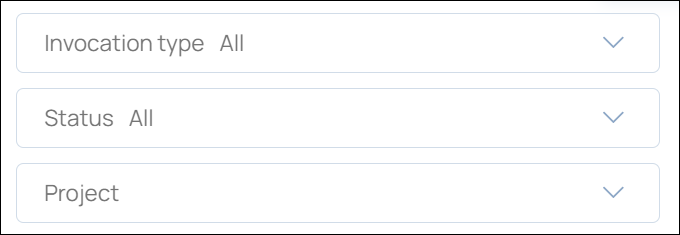
The final filters in the menu accept text entries:
Add the filters you need and click Apply.
The filters apply to subsequent searches and to the execution table until you remove them.
Changing Table Columns
To add, remove, and rearrange execution table columns:
In the Search bar, click the options icon:
In Column Preferences:
Click x on a shaded column to remove it.
Click + on an unshaded column to add it.
Drag shaded columns to rearrange the order in which they display in the table.
Click Apply.
Viewing Your Executions
To view your Pipeline and Task executions:
In the Search bar, click the options icon:
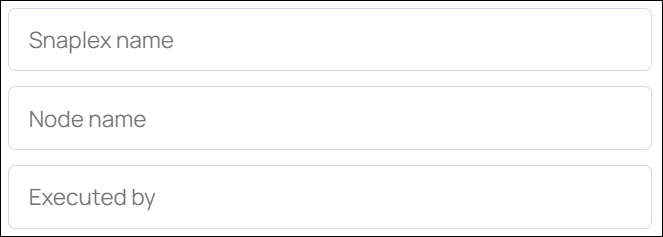
In Advanced Options, click Executed by and start entering your username.
When your username displays, click + to select it.
Click Apply.
The execution table updates to show your executions. The filter remains until you remove it.
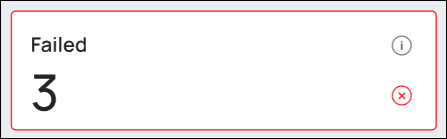
Finding a Failed Execution and Viewing its Details
To view the details of a failed Pipeline or Task:
Click the Failed summary card:
In the execution table, click the Pipeline or Task of interest to display details. Learn more about Execution Details.