...
The Execution overview page contains the following elements and controls, starting at the top left side of the screen:
Callout | Element | Description |
1 | 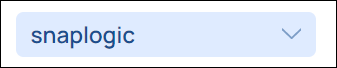 | Admins and users with accounts on multiple Orgs can use this pull-down to switch between Orgs. |
2 | 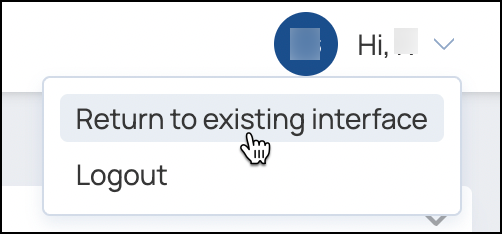 Image Removed Image Removed Image Added Image Added | Use the dropdown by your name to return to the existing interface or logout. |
3 | 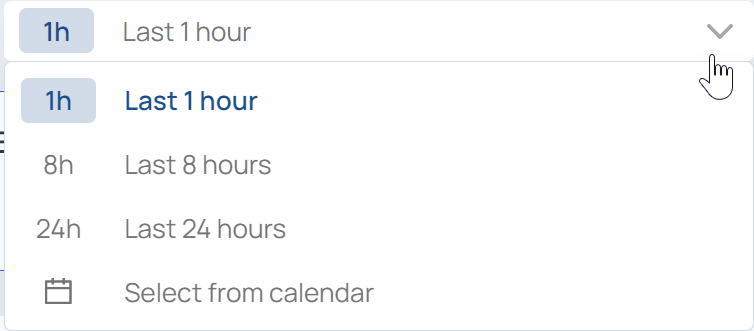 Image Removed Image Removed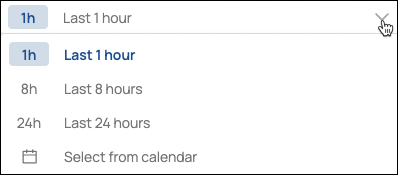 Image Added Image Added | Use the dropdown menu to filter the executions displayed in the table by hour periods or a by a date range. |
4 | 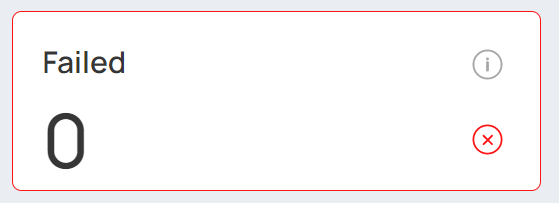 Image Removed Image Removed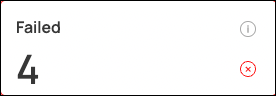 Image Added Image Added | Execution summary cards display the number of Pipeline and Task executions by status: Failed. Total executions that failed during selected time period. Executing. Total executions currently running. Completed. Total executions that completed with and without warnings during selected time period. Ultra Executions. Total Ultra Tasks during selected time period, including failed runs and successful runs.
| Info |
|---|
Tips: If the Completed card does not display, try: To filter the execution table by status, click a summary card. The icon on the summary card also appears in the Status column of the execution table.
|
|
5 | 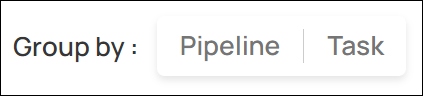 | Group by options filter the executions shown in the table by Pipeline or Task: To view only one category of executions, click Pipeline or Task. To remove the filter and view both categories, click X or the highlighted group: 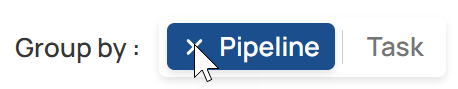
|
6 |  Image Removed Image Removed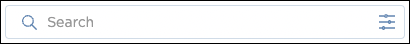 Image Added Image Added | Search the execution list, click the options icon to: Filter the execution list. Add, remove, and rearrange execution table columns.
|
7 |  Image Removed Image Removed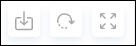 Image Added Image Added | From left to right, table toolbar buttons provide the following functionality: Download to a CSV file on your local machine. Refresh the execution list. Show or hide the summary card panel.
|
8 | 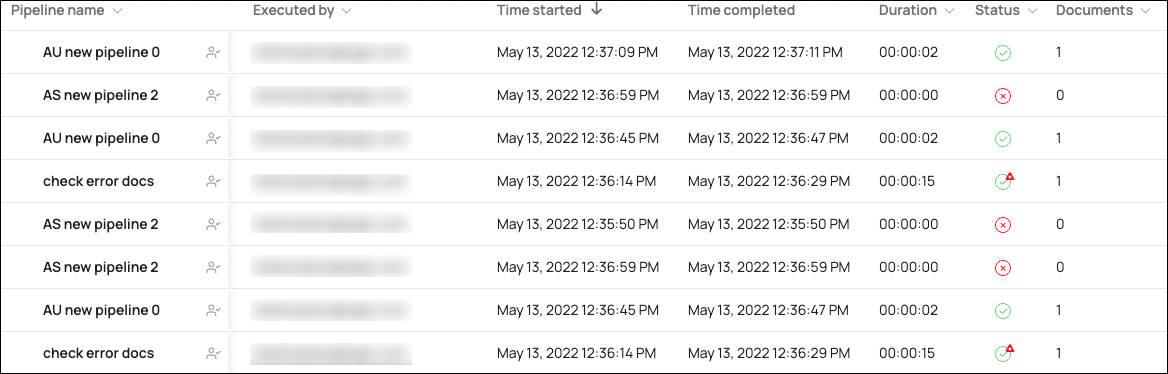 Image Modified Image Modified | View and manage the list of executions: View details of an execution by clicking it. Learn more: Execution Detail. Sort the table by clicking column headers. Copy a value in the table to the clipboard, by hovering over a cell and clicking the copy icon (  ). ). Below execution rows: View the time that the list was last refreshed. Change the number of items displayed on each page. Navigate to the previous page, the next page, or a specific page number.
| Info |
|---|
Tips: Status column icons include: 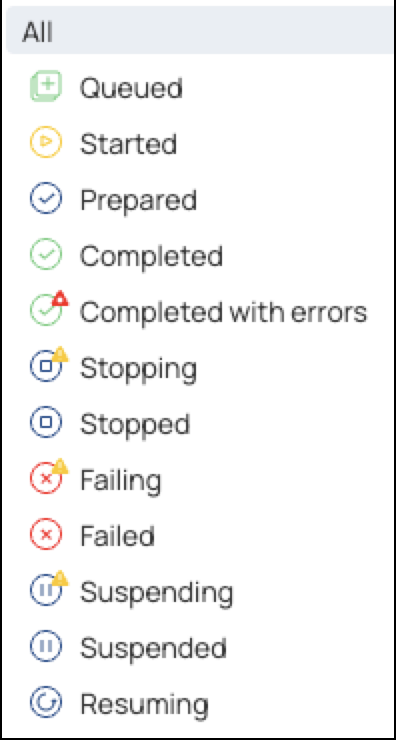 Image Removed Image Removed Image Added Image AddedAdd, remove, and reorder columns with Column Preferences. Open Column Preferences by clicking the options icon in the Search bar.
|
|
9 |  | Expand or collapse navigation panel. |
10 |  | Page through executions and select how many to show per page. |
...
