...
The API dashboard wall displays metrics for APIs that are published to the your API Manager Developer Portal and all Triggered and Ultra Tasks associated with the API Manager. You can access the API dashboard wall from the subtab on the SnapLogic Dashboard. The API dashboard wall is composed of widgets that help you visualize various API metrics and the types of metrics that provide insights into your APIs. You can access the dashboard by clicking the API tab in the SnapLogic Dashboard.
As an Org admin, you can also monitor statistics that give a summary view of any selection of APIs within your Org. As an API developer, you can track the consumption of your APIs, troubleshoot errors, and analyze performance (latency). Similar to the functionalities available on the Pipeline and Tasks dashboard tabs, you can view assets to which you have read and write permissions.
...
The API dashboard renders API usage metrics in visual and detail statistical views. The API Details table lists the APIs that are handling the most requests. The order of target APIs defaults to requests per minute, essentially giving you a view of the top ten APIs. You can also sort by error percentage and latency, so that you can analyze problems your API consumers are facing when ingesting APIs from your developer portal. These details combined with the widgets give API developers the tools they need to analyze consumption trends and improve the user experience of their APIs.
...
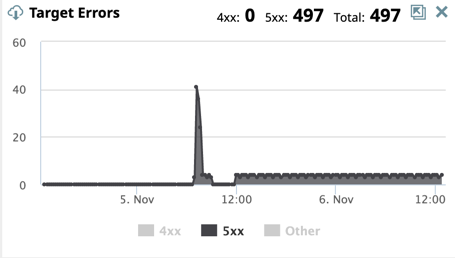
Target Errors: The 400 and 500 errors that occur during the Pipeline prepare state and execution phaserun.
Error Percentage: The errors that occur with the API calls as a percentage of the total number of requests. This metric indicates ineffective API design, weak API documentation, and/or even malicious actors accessing the API ecosystem.
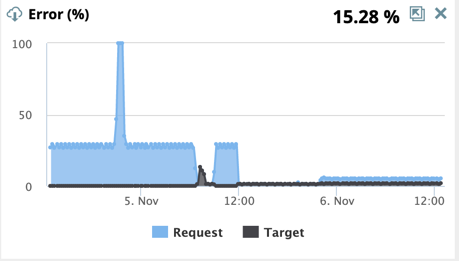
Request Errors: The errors that violate a policy or fail authentication, resulting in a canceled request. Pipelines are not prepared or executed in this scenario.
Target Errors: The errors that occur during the Pipeline prepare state and execution phaserun.
99 Percentile Latency: Latency is the number of milliseconds the API ecosystem takes to respond to a call. The 99p latency value means that 99 out of 100 API data samples fall below this value. This metric indicates the efficiency or the cycle - time of the API ecosystem.
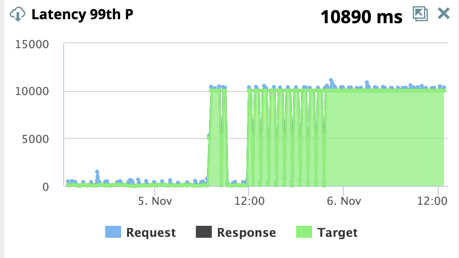
Request Latency: The time taken to link the Task definition, run API policies, and authenticate the request in milliseconds (ms).
Target Latency: The time taken to prepare and execute the Pipeline to completion in milliseconds (ms).
Response Latency: The time taken to collect statistics and process the response to the caller in milliseconds (ms).
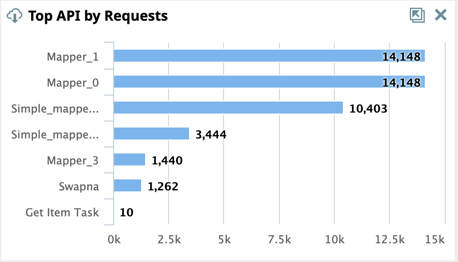
Top API by Request: The top 10 APIs in your Org by request.
...