...
1 Hour: View the statistics for the last hour.
8 Hours: View the statistics for the last eight hours.
24 Hours: View the statistics for the last 24 hours.
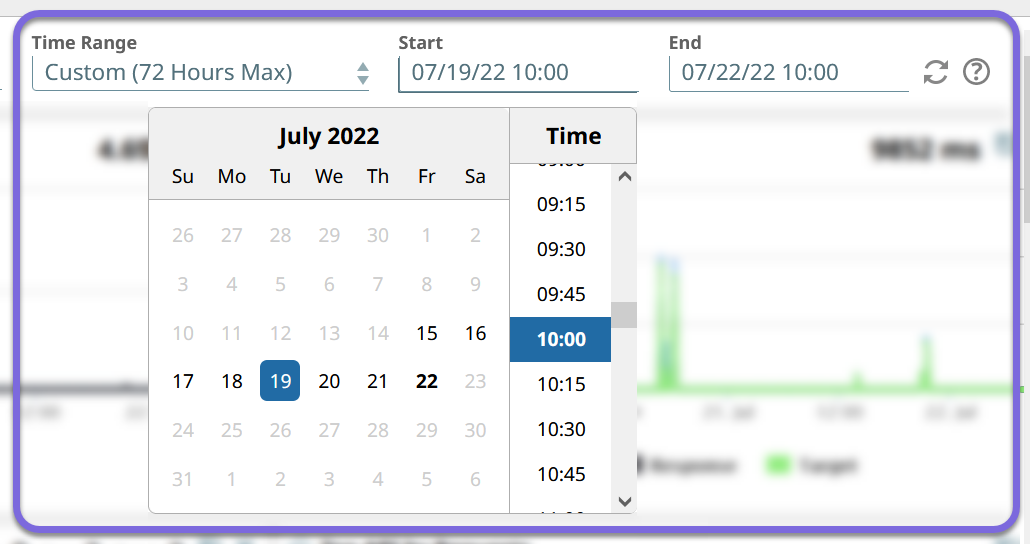
Custom: View the statistics for a target time period of days/hours, limited to the last seven days.
| Note |
|---|
Customized Date RangesWhen selecting the date range, the value for the End date is automatically adjusted to a maximum span of 72 hours once you choose the Start date. You cannot select a time period greater than 72 hours. |
...
Viewing and Hiding the Available Panels
You can view the metrics for each API in the specified period in the All API Details table. Clicking on the API call opens a separate window with details of that API.
...
| Info |
|---|
|
...
To view the API dashboard, click Dashboard > API. By default, SnapLogic displays data for the past hour.
Analyzing Request Details
...