In this Article
...
As a Pipeline executes, the statistics are updated periodically so that you can monitor its progress. If the execution is successful, the Snaps should transition from Started to Completed, as shown in the following image.
| Snap Statistics tab | Extra Details tab |
|---|---|
|
|

The Snap Statistics tab summarizes pipeline execution time, including fractional components representing seconds. The Extra Details tab gives a precise timestamp of pipeline start and completion times, aiding in understanding execution duration.
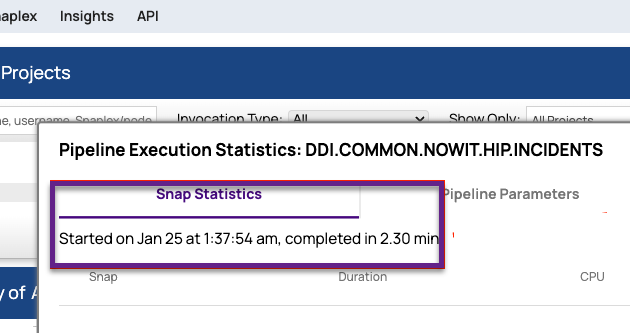
You might notice a difference between the pipeline execution time displayed in the Snap Statistics tab and the Extra Details tab on the pipeline dashboard. For example, the Snap Statistics tab displays pipeline execution completion time as 2.30 minutes, and the Extra Details tab shows completion time from Jan 25 at 1:37:54 am till Jan 25 at 1:40:12 am.
The time displayed in the Snap Statistics tab does not represent minutes and seconds in the traditional sense. Instead, it includes a fractional component representing a portion of a second. For instance, in this example, the 0.30 fraction of the time translates to 30/100*60 = 18 seconds. The actual execution time for the pipeline would be 2 minutes and 18 seconds. This aligns with the completion time indicated in the extra details tab.
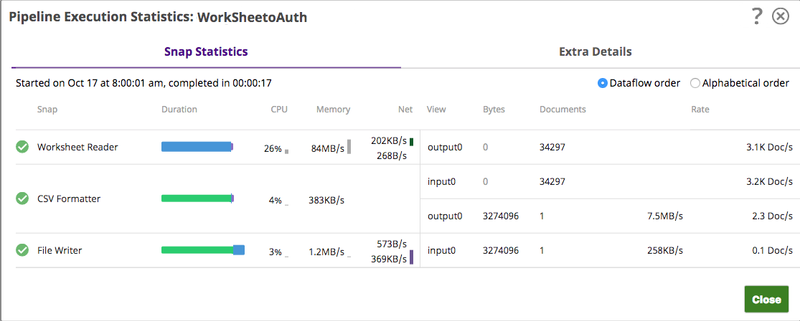
Snap Statistics
This tab displays the overall statistics for each Snap on the left and the statistics for the Snap's input, output, and error views on the right. You can change the order of the Snaps in the table by selecting Dataflow or Alphabetical on the top right. The Alphabetical listing orders statistics by the Snap name, while Dataflow orders statistics by placing adjacent Snaps together in the table (though if two or more Snaps are at the same depth in a Pipeline, they are shown in random order because of the algorithms used to sort them).
...
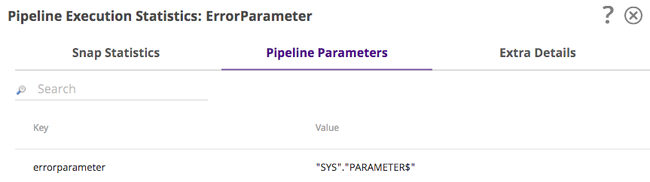
While this tab appears for all Pipelines, it only displays information for those Pipelines that are run either by a task or by another Snap (such as the Pipeline Execute Snap). Values are returned only for those parameters that have Capture selected in the Pipeline Properties dialog.
Extra Details
The Extra Details tabs provides basic information about the Pipeline and its execution, including details about Pipeline type and run policy.
...
In the following image, the Extra Details tab displays information about a Resumable Pipeline.
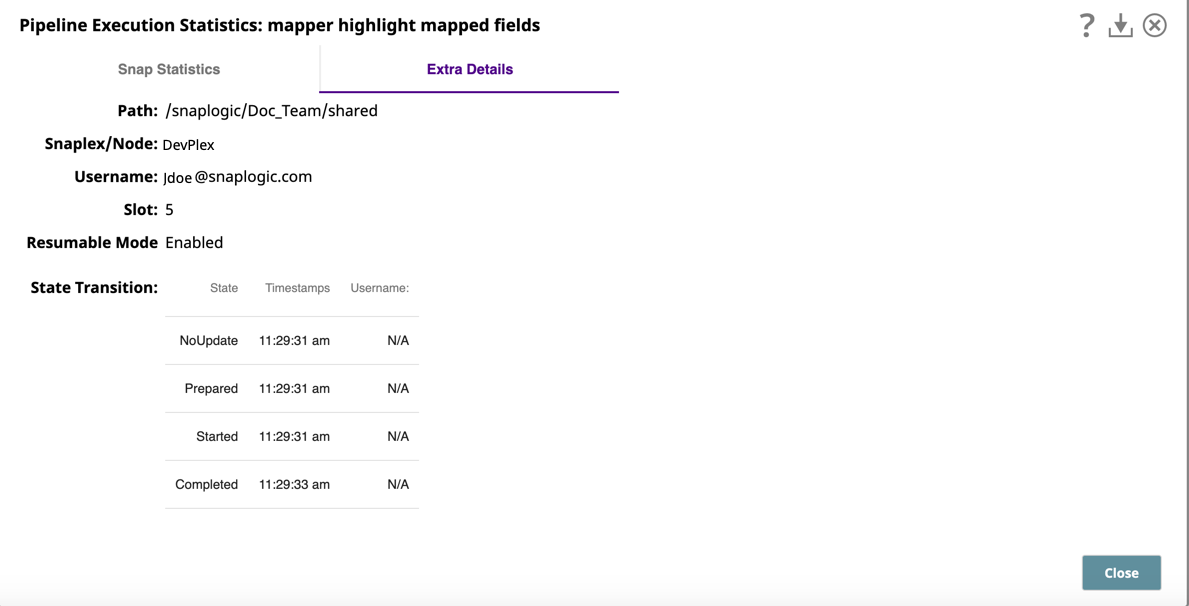
The Extra Details tab provides additional information about the Pipeline run, including:
- Path to the pipeline.
- The Snaplex node used to run the Pipeline.
- The username of the person who ran the Pipeline.
- The Slot Count. See Maximum Slots on the Node Properties tab on the Update Snaplex dialog.
- Resumable Mode. Displays Enabled if the Pipeline is resumable. If not, the status is Disabled.
- The Task name. The name of the Task (if applicable).
- The Max-In-Flight value. The maximum number of documents that can be processed by an Ultra task instance at any one time.
- The Close reason for when an Ultra task goes into the Completed state.

- Reference no longer exists or is inaccessible
- Host Snaplex node restarted
- The Ultra task has been updated
- The task is no longer active
- Closing Ultra Pipeline instance to balance instances across the Snaplex
- Ultra Requests. These statistics are displayed during the processing of documents.

- Receive Time. The time that the request is received.
- Client IP. The IP address that the FeedMaster sees when the load balancer forwards a request.
- Original IP. The IP address of the external client that the load balancer, when configured to do so, forwards to the FeedMaster.
- Method. The underlying HTTP method of the request.
- Size. The size of the document payload in bytes.
- Extra Path. The path of the Ultra Pipeline task.
The Request History for Ultra tasks. These statistics display the last 100 documents processed in the Ultra Pipeline.
Info title Pipeline Monitoring API Available You can also collect the Ultra history statistics using the Pipeline Monitoring API.
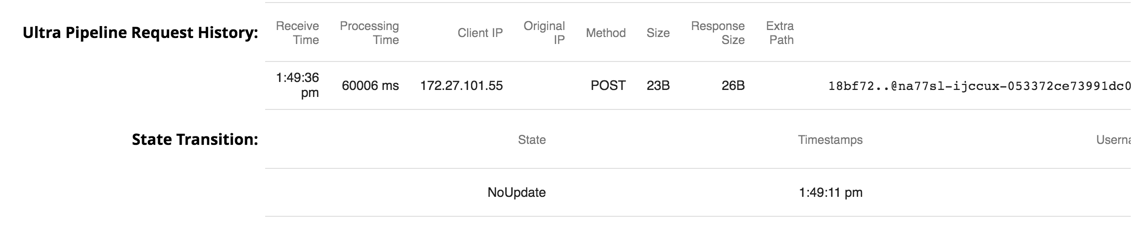
Some statistics in common with those from the Ultra Request report are identical.Receive Time. The time that the request is received.
Processing Time. The total time for the Ultra Pipeline to process the documents associated with this request. For example, if the input document is copied, this time includes all the time needed to process each copy.
- Client IP. The IP address that the FeedMaster sees when the load balancer forwards a request.
- Original IP. The IP address of the external client that the load balancer, when configured to do so, forwards to the FeedMaster.
- Method. The underlying HTTP method of the request.
- Size. The size of the document payload in bytes.
- Response Size. The size of the document in bytes payload inside the response.
Extra Path. The path of the Ultra Pipeline task.
State Transition. These statistics display when multiple runs of an Ultra Pipeline occur.
State. Current state of the Ultra Pipeline.
Timestamp. The time that the most recent Ultra Pipeline execution occurred.
Username. The username of the person invoking the Ultra Pipeline.