...
Error Percentage: The errors that occur with the API calls as a percentage of the total number of requests. This metric indicates ineffective API design, weak API documentation, and/or even malicious actors accessing the API ecosystem.
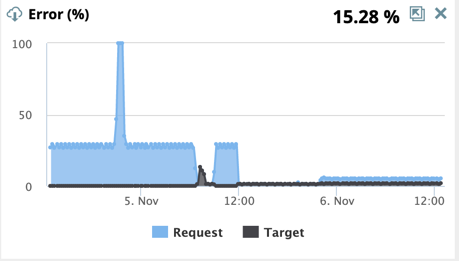
Request Errors: The errors that violate a policy or fail authentication, resulting in a canceled request. Pipelines are not prepared or executed in this scenario.
Target Errors: The errors that occur during the Pipeline prepare state and run.
99 Percentile Latency: Latency is the number of milliseconds the API ecosystem takes to respond to a call. The 99p latency value means that 99 out of 100 API data samples fall below this value. This metric indicates the efficiency or the cycle time of the API ecosystem.
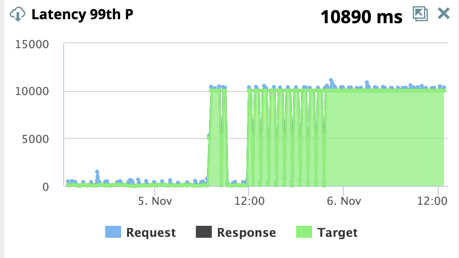
Request Latency: The time taken to link the Task definition, run API policies, and authenticate the request in milliseconds (ms).
Target Latency: The time taken to prepare and execute the Pipeline to completion in milliseconds (ms).
Response Latency: The time taken to collect statistics and process the response to the caller in milliseconds (ms).
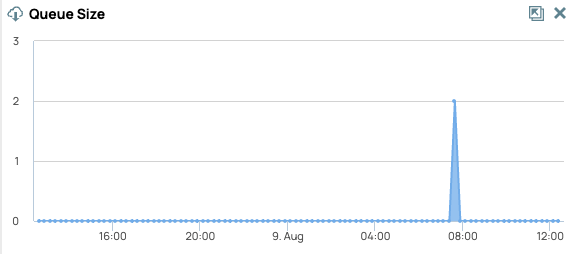
Queue Size: The number of requests waiting to be processed by your Ultra Tasks. The vertical access gives the number of requests in the queue, and the horizontal access is the timeline.

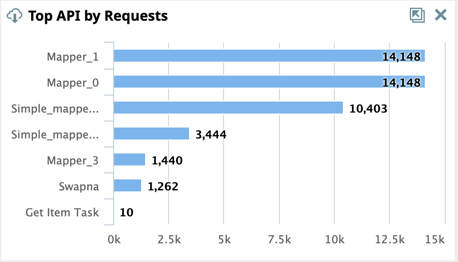
Top API by Request: The top 10 APIs in your Org by request.
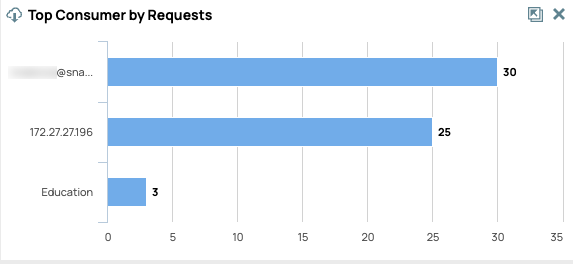
Top Consumer by Requests: The top number of requests by API consumer.

Selecting a Widget
...