Overview
A Snaplex
is a runtime environment for Pipelines. One or more nodes can belong to a Snaplex, with Pipeline execution requests automatically load-balanced across nodes. The algorithm is least-loaded, with priority on memory usage. If there are similarly loaded nodes, the algorithm randomizes the Pipeline execution across them. You can deploy one or many Snaplexes as required to run pipelines and process data.
Where are Snaplexes Used in the SnapLogic Platform
Snaplexes are used in nearly every area of the SnapLogic platform, performing the following functions:
Standard, Resumable, and Ultra Pipelines
Triggered Task and Scheduled Tasks
SnapLogic APIs and Proxies
API Policies in APIM and Tasks in Manager
AutoSync integrations
Types of Snaplexes
The Snaplex can be a Cloudplex (SnapLogic Managed) or a Groundplex (Self-managed). Snaplexes are configured by SnapLogic when the customer is provisioned, and Self-managed Snaplexes can be added anytime. For Cloudplexes, SnapLogic will install and maintain the Snaplex nodes. For Groundplexes, the customer has to install the Snaplex software on nodes in the customer data center.
You can deploy one or many Snaplex instances as required to run Pipelines and process data. A Snaplex consists of one or more nodes and can be one of the following types:
Cloudplex: All Cloudplex instances run inside the SnapLogic
IIP. A Cloudplex is ideal if you require integrations that orchestrate across cloud applications (such as Salesforce, ServiceNow,
and Workday) with no on-premises connections that do not require any software to run behind a firewall.
| title | Java 11 on Cloudplex Instances |
|---|
Use SnapLogic Manager and Dashboard to administer and monitor your Cloudplex.
Groundplex: If you need on-premises connectivity (such as SAP, Oracle, or Microsoft Dynamics AX) then you require a Groundplex that runs behind the firewall. Although Groundplex nodes run on private or virtual private data centers, Groundplex instances are managed remotely by the SnapLogic Platform's control plane.
Selecting a Snaplex for Pipelines
You can configure which Snaplex a Pipeline will use in the following ways:
- With a Pipeline open in Designer, you can select from the Snaplex drop-down menu a Snaplex instance on which the Pipeline should run.
- When you configure a Scheduled or Triggered Task, you can select the Snaplex to run the Pipeline.
- The Pipeline Execute Snap has a Snaplex property that specifies where the child Pipeline is executed. When using a Pipeline Execute Snap, if you leave the property blank or use pipe.plexPath expression, the child Pipeline is executed on the same node as the parent. When running a parent and child Pipeline on the same node, data is not transferred over a network, which improves the performance of the Pipeline execution.
When using the Pipeline Execute Snap, if you specify a different Snaplex to run a child Pipeline, then the input documents and Pipeline parameters are passed (through the control plane using encrypted transport) to a node in the designated Snaplex.
- To set a dedicated Snaplex for a project, an Org admin can move a Snaplex from the Shared project to any other project. Only those Pipelines within the new project have access to that Snaplex.
| Panel | ||||||||
|---|---|---|---|---|---|---|---|---|
| ||||||||
List of articles in this section
|
Snaplex State
In the default state, all nodes in the Snaplex can accept new Pipeline execution requests, and Pipeline execution is load-balanced automatically across the nodes.
Snaplex State Transition
A state transition can occur for many reasons – because of a Snaplex version update, a configuration change to the Snaplex, or a restart. When a state transition is required for a Snaplex, one node (or more for larger Snaplex instances) at a time enters a Cooldown state, in which new Pipeline execution requests are not sent to the node. In this state, the node waits for currently running Pipelines to complete. For long-running Pipelines that are set up to poll continuously (like a Pipeline using File Poller or JMS Consumer Snaps) and Ultra Pipelines, the Pipeline is sent a state notification to allow the Pipeline to stop polling for new records.
Pipeline Execution Timeout
A node can stay in the Cooldown state for a configurable timeout (the default is 15 minutes), called the Restart Max Wait Time, which you can set in the Snaplex Settings tab of the Update Snaplex and Create Snaplex dialogs. If all Pipelines complete within this timeout, then the node transitions to the required state. If Pipelines are still running after this timeout, then those Pipelines terminate to allow the transition to the required state.
You can increase the default value of 15 minutes to a higher value on Snaplex instances that run longer-running Pipelines (in terms of duration). However, for polling and Ultra Pipelines, you do not have to increase this value since the Pipeline is notified to stop polling for new records, and thus allowing the Pipeline to terminate cleanly.
| Note | ||
|---|---|---|
| ||
|
Snaplex Version Change
When a Snaplex version change is initiated, one node at a time undergoes a transition of the state. After the node enters the Cooldown state and running Pipelines complete, the JCC process on the node terminates and restarts with the new version of the Snaplex binaries. Since the Snaplex version upgrade happens in a rolling manner with no downtime required on Pipeline executions, your interaction is not required during the rolling restart—all node transitions are completed automatically.
Snaplex Maintenance Mode
When you place a Snaplex node in maintenance mode, the node enters the Cooldown state and waits for running Pipelines to complete. After all Pipelines complete or the Snaplex Restart Max Wait timeout is reached, the node enters maintenance mode, during which the node does not accept any Pipeline execution requests.| Note |
|---|
We do not recommend manually placing the nodes in maintenance mode during a Snaplex version update or configuration change. |
Cloudplex Behavior
Cloudplex nodes reinitialize with each Snaplex version upgrade. Subsequently, you will notice the following change:
Any files created on the local file system (using file:// protocol) will not be accessible across the Snaplex upgrades, since the nodes will be new. Hence, we recommend using Cloud storage for files you need to access across the Snaplex upgrade process. Do note that Cloudplex does not create any backup filesComparison of Snaplex Types
Type of Snaplex | Advantages | Disadvantages |
|---|---|---|
SnapLogic Managed Snaplex (Cloudplex) |
|
|
Self-managed (Groundplex) |
|
|
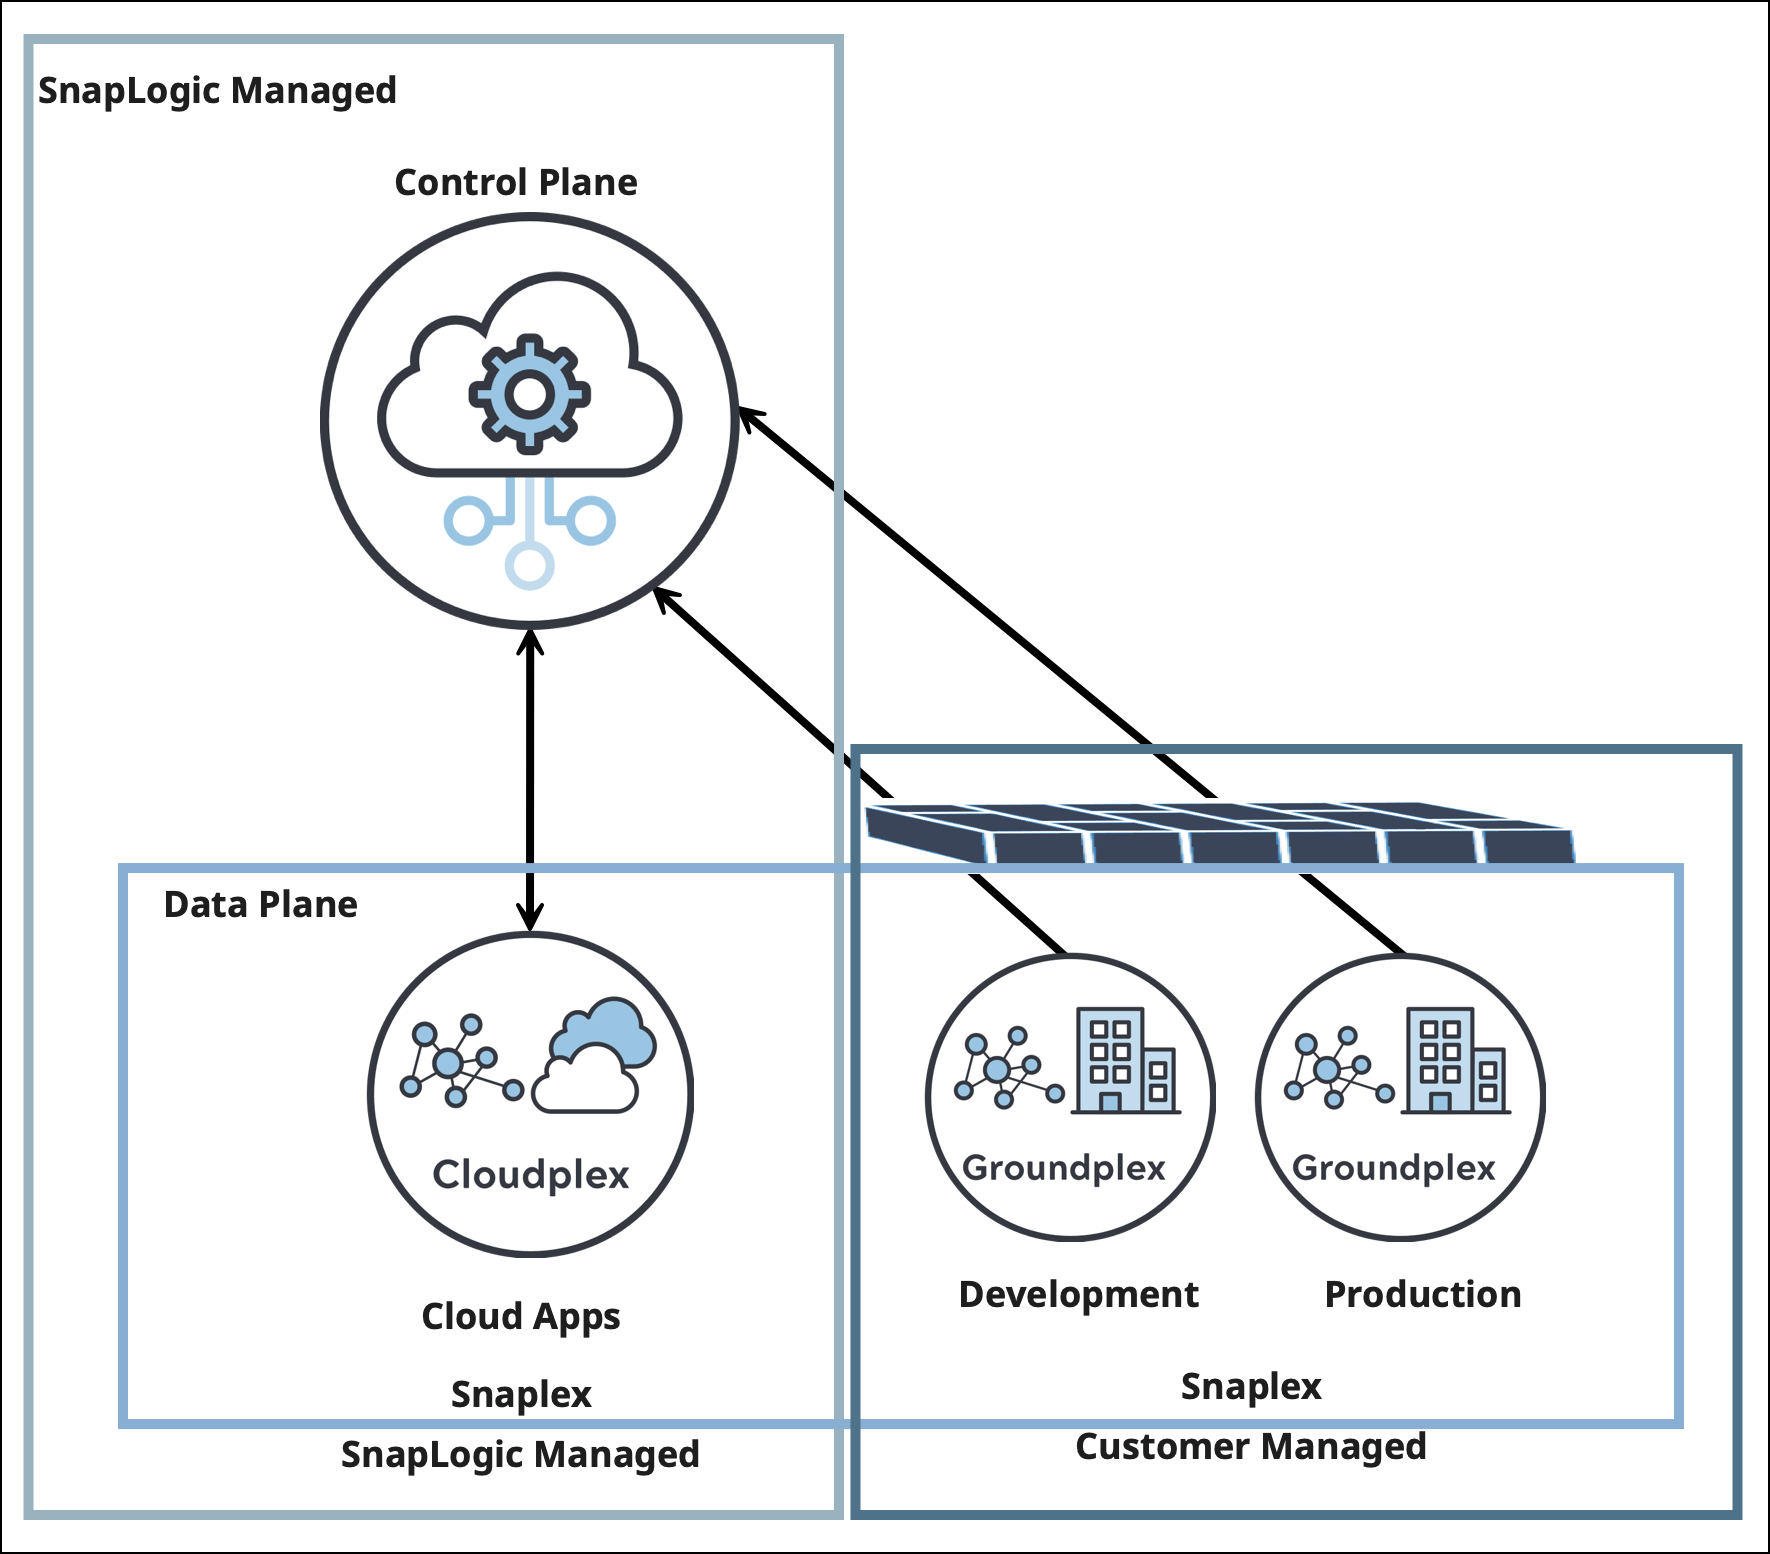
Snaplex Architecture
The Snaplex represents the Data Plane in the SnapLogic ecosystem. Users who access the SnapLogic application through the UI and most of the Public APIs communicate are communicating with the Control Plane.
The following diagram illustrates the data flow in the SnapLogic architecture for both types of Snaplexes and the relationship between the Control Plane and Data Plane.
| Info |
|---|
In a Self-managed Snaplex (Groundplex), the Snaplex is managed by the customer’s organization. |
Managing a Snaplex
Who Can Create or Update a Snaplex
You must be an Org admin to view and change the values of a Snaplex. In terms of Snaplex types, Org admins can create Groundplexes, and only SnapLogic can create Cloudplexes. However, an Org admin can edit basic Cloudplex settings, such as the Snaplex version it runs.
Monitoring your Snaplex
You can monitor Snaplexes in Monitor or in the SnapLogic Dashboard. The Dashboard Health tab, which is the default tab, shows Snaplexes on the left side in a scrolling menu. The Infrastructure Overview provides metrics across all Snaplexes in an Org for target time spans, as deep-dive capabilities. Clicking on a Snaplex tile in the left navigation pane expands the Snaplex page, where you can view key indicators from this top-level view, such as the memory utilization on the Snaplex node. The Snaplex Health Wall also displays system alerts on a subtab, enabling you to take action when an issue occurs. You can also configure Snaplex-specific alerts using thresholds. The alert appears on the Snaplex Health Wall when the threshold is reached. Learn more about setting alert notifications.

The Snaplex subtab provides a dedicated view of all the Snaplexes in your Org. Multiple graphs display utilization metrics for CPU, memory, disk capacity, and other metrics.
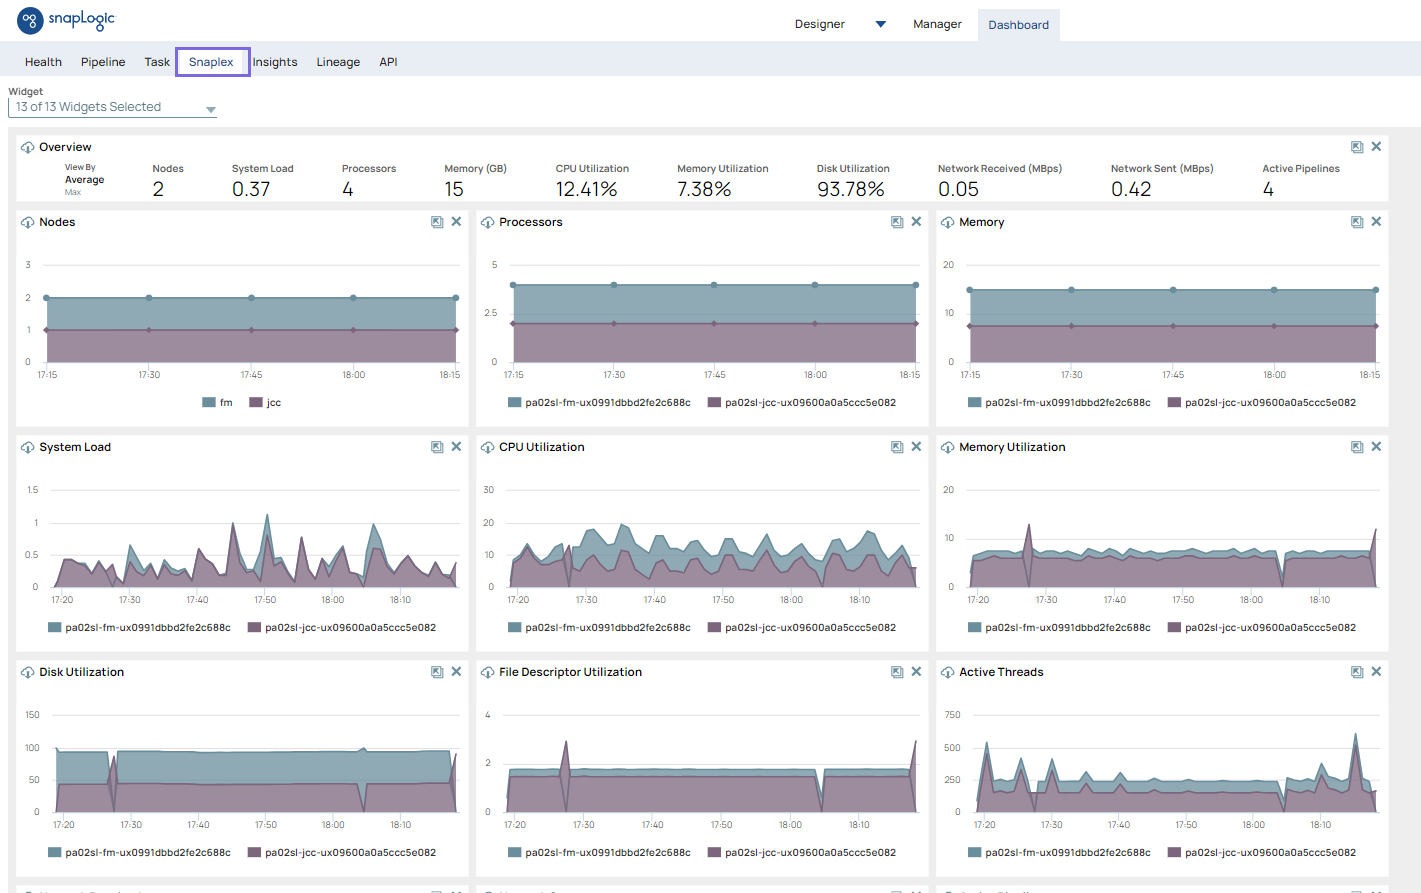
This information is also available in Monitor.