...
Table of Contents maxLevel 3 absoluteUrl true
Overview
You can deploy Groundplex nodes in a Kubernetes environment and enable elastic scaling of resources for Groundplex nodes by completing the steps in this tutorial.
HPA Concepts
Kubernetes (K8s) is a container-orchestration system for automating computer application deployment, scaling, and management. In Kubernetes, the containers that share storage and network resources are called Pods. Groundplex node resources are represented by Pods in the SnapLogic implementation of elastic scaling, which leverages the Horizontal Pod Autoscaler (HPA), a Kubernetes API resource, that automatically scales the number of Pods in a deployment based on the observed CPU/Memory utilization. The number of Pods made available in a cluster depends on the load on the server farm. Other types of metrics require a monitoring application like Prometheus Adapter software.
Setup Workflow
- Step 1: Setting up the Snaplex in the UI
- Step 2: Setting up the Resource Metric Collection
- Step 4: Installing the Snaplex Helm Chart
Step 1: Setting up the Snaplex in the UI
- If you have not created a Snaplex already, navigate to Manager > shared and create a Snaplex.
Make sure to select Groundplex as the Snaplex type. - In Manager, click the target Snaplex to display the dialog window.
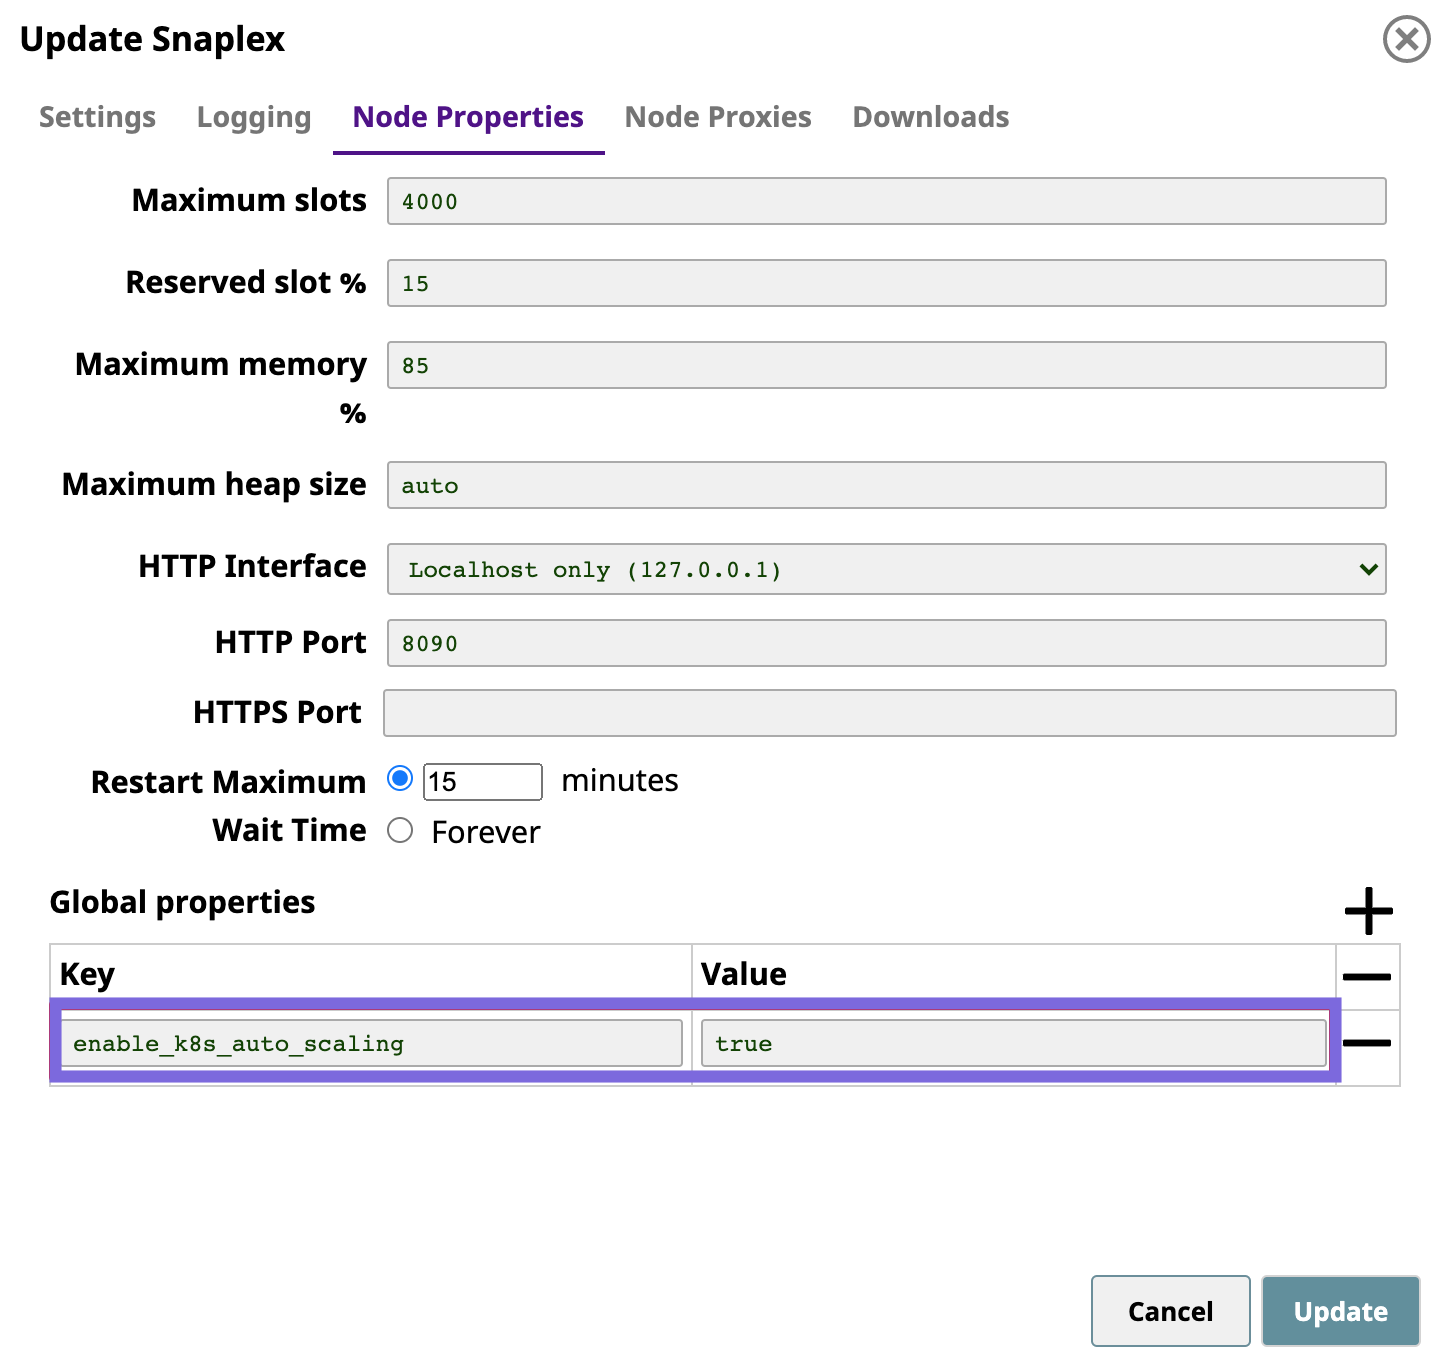
Click the Nodes tab, and add the following entries to the Global Properties:
Key Value enable_k8s_auto_scaling true The following screenshot shows the added setting:
- Click Update. If you are creating the Snaplex, click Create.
You can now set up the Metrics Server software.
Step 2: Setting up the Resource Metric Collection
- Install the Metrics Server software into your Kubernetes system using this AWS user guide.
- Verify the installation by running the following command on your console:
...
NAME READY UP-TO-DATE AVAILABLE AGEmetrics-server 1/1 1 1 6d20h
Step 3: Installing and Setting Up the Prometheus Software and Adapter
You must install and set up the Prometheus software and adapter to track custom metrics. SnapLogic uses the kube-prometheus-stack package from the following sources:
Installing the Prometheus Software
- Create the custom_values.yaml file.
The following example shows custom_values.yaml chart.
Code Block title custom_values.yaml prometheus: service: type: LoadBalancer port: 80 # AWS EKS specific setting annotations: service.beta.kubernetes.io/aws-load-balancer-internal: "true" prometheusSpec: # Expose additional targets which can be discovered by Prometheus additionalScrapeConfigs: - job_name: 'snaplogic-snaplex-hpa-jcc-autoscale-metrics' scrape_interval: 15s metrics_path: '/autoscale_metrics' # default is metrics kubernetes_sd_configs: - role: pod namespaces: names: - default # If you install the Snaplex in your own namespace, you have to provide here. # - snaplogic scheme: https tls_config: insecure_skip_verify: true relabel_configs: - source_labels: [__meta_kubernetes_namespace] action: replace target_label: namespace - source_labels: [__meta_kubernetes_pod_name] action: replace target_label: pod - source_labels: [__address__] action: replace regex: ([^:]+)(?::\d+)? replacement: ${1}:8081 target_label: __address__ - source_labels: [__meta_kubernetes_pod_label_app_kubernetes_io_type] action: keep regex: jcc # Name for the Pod to match grafana: # set 'enabled: true' if you want to enable the Grafana dashboard enabled: false service: type: LoadBalancer port: 80 # AWS EKS specific setting annotations: service.beta.kubernetes.io/aws-load-balancer-internal: "true" alertmanager: enabled: falseYou can enable the Grafana dashboard in the chart.
Create your own namespace by adding the namespace entry into the following field.
prometheusSpec.additionalScrapeConfigs.kubernetes_sd_configs.namespaces.namesIn the custom_values.yaml Helm chart, the namespace is snaplogic; however, it is commented out in the chart. To use SnapLogic as your namespace, uncomment those lines:Code Block # If you install the Snaplex in your own namespace, you have to provide here. # - snaplogic
Install Prometheus software by deploying the following Helm chart.
Code Block NAME_SPACE=monitoring PROMETHEUS_VERSION=14.0.1 PROM_RELEASE_NAME=prometheus # create namespace kubectl create namespace $NAME_SPACE # install Prometheus helm repo add prometheus-community https://prometheus-community.github.io/helm-charts helm install $PROM_RELEASE_NAME prometheus-community/kube-prometheus-stack --version $PROMETHEUS_VERSION --namespace $NAME_SPACE -f custom_values.yaml
Verify that the Prometheus and Grafana services by running the following command.
$ kubectl get all -n monitoringCode Block NAME READY STATUS RESTARTS AGE pod/alertmanager-prometheus-kube-prometheus-alertmanager-0 2/2 Running 0 19m pod/prometheus-grafana-6f5448f95b-68zdt 2/2 Running 0 19m pod/prometheus-kube-prometheus-operator-8556f58759-tlxb8 1/1 Running 0 19m pod/prometheus-kube-state-metrics-6bfcd6f648-ckzf6 1/1 Running 0 19m pod/prometheus-prometheus-kube-prometheus-prometheus-0 2/2 Running 1 19m pod/prometheus-prometheus-node-exporter-fgc5x 1/1 Running 0 19m pod/prometheus-prometheus-node-exporter-r7dgf 1/1 Running 0 19m pod/prometheus-prometheus-node-exporter-rd8pz 1/1 Running 0 19m NAME TYPE CLUSTER-IP EXTERNAL-IP PORT(S) AGE service/alertmanager-operated ClusterIP None <none> 9093/TCP,9094/TCP,9094/UDP 19m service/prometheus-grafana LoadBalancer 10.100.153.99 internal-xxxx.us-west-2.elb.amazonaws.com 80:30324/TCP 19m service/prometheus-kube-prometheus-operator ClusterIP 10.100.234.140 <none> 443/TCP 19m service/prometheus-kube-prometheus-prometheus LoadBalancer 10.100.20.88 internal-xxxx.us-west-2.elb.amazonaws.com 80:31644/TCP 19m service/prometheus-kube-state-metrics ClusterIP 10.100.184.76 <none> 8080/TCP 19m service/prometheus-operated ClusterIP None <none> 9090/TCP 19m service/prometheus-prometheus-node-exporter ClusterIP 10.100.216.232 <none> 9100/TCP 19m NAME DESIRED CURRENT READY UP-TO-DATE AVAILABLE NODE SELECTOR AGE daemonset.apps/prometheus-prometheus-node-exporter 3 3 3 3 3 <none> 19m NAME READY UP-TO-DATE AVAILABLE AGE deployment.apps/prometheus-grafana 1/1 1 1 19m deployment.apps/prometheus-kube-prometheus-operator 1/1 1 1 19m deployment.apps/prometheus-kube-state-metrics 1/1 1 1 19m NAME DESIRED CURRENT READY AGE replicaset.apps/prometheus-grafana-6f5448f95b 1 1 1 19m replicaset.apps/prometheus-kube-prometheus-operator-8556f58759 1 1 1 19m replicaset.apps/prometheus-kube-state-metrics-6bfcd6f648 1 1 1 19m NAME READY AGE statefulset.apps/alertmanager-prometheus-kube-prometheus-alertmanager 1/1 19m statefulset.apps/prometheus-prometheus-kube-prometheus-prometheus 1/1 19m
- Access the Prometheus and Grafana UIs with the respective IP addresses under the EXTERNAL-IP column.
Installing the Prometheus Adapter
- Obtain the Prometheus Adapter:
Install the Prometheus adapter the following command:
Code Block NAME_SPACE=monitoring ADAPTER_VERSION=2.12.1 ADAPTER_RELEASE_NAME=prometheus-adapter # install Prometheus Adapter helm install $ADAPTER_RELEASE_NAME prometheus-community/prometheus-adapter --version $ADAPTER_VERSION --namespace $NAME_SPACE -f adapter_custom_values.yaml
Note You have to create the adapter_custom_values.yaml file and apply it during Helm Chart installation.
Create the adapter_custom_values.yaml file and apply it during the Helm Chart installation:
Code Block title adapter_custom_values.yaml prometheus: # Run `kubectl get svc -n namespace` to get the url of Prometheus url: http://prometheus-kube-prometheus-prometheus.monitoring.svc # Prometheus's port. Currently it is LoadBalancer with 80 default. port: 80 replicas: 1 rules: # Whether to enable the default rules default: false # Add custom metrics API here custom: # plex_queue_size API - seriesQuery: 'plex_queue_size' resources: overrides: namespace: {resource: "namespace"} pod: {resource: "pod"} name: matches: ^(.*) as: "plex_queue_size" metricsQuery: <<.Series>>{<<.LabelMatchers>>}
Verify the Prometheus Adapter installation by running the following command:
Code Block $ kubectl get --raw /apis/custom.metrics.k8s.io/v1beta1 | jq . { "kind": "APIResourceList", "apiVersion": "v1", "groupVersion": "custom.metrics.k8s.io/v1beta1", "resources": [ { "name": "pods/plex_queue_size", "singularName": "", "namespaced": true, "kind": "MetricValueList", "verbs": [ "get" ] }, { "name": "namespaces/plex_queue_size", "singularName": "", "namespaced": false, "kind": "MetricValueList", "verbs": [ "get" ] } ] }
Integrating Grafana Analytics with Elastic Scaling
- Import the following SnapLogic template to your Grafana analytics from the following source:
https://grafana.com/grafana/dashboards/14363
The page describes multiple methods for importing the template. - In the custom_values.yaml chart, set the Enabled field to true.
Access the Grafana UI through the IP addresses under the EXTERNAL-IP column from Step 2 of Installing the Prometheus Application.
Info You can also use the
kubectl topcommand to monitor the CPU and Memory for the pods.
Step 4: Installing the Snaplex Helm Chart
- Enter the following values into your Helm Chart:
- CPU and memory requests for the nodes.
- HPA (Horizontal Pod Autoscaler) enabled flag.
- minReplicas. The lower limit for the number of replicas to which the autoscaler can scale down. The value defaults to 1 pod and cannot be set to 0.
- maxReplicas. The upper limit for the number of pods that can be set by the autoscaler. This value cannot be smaller than the value set for the MinReplicas.
- targetPlexQueueSize. The target value for the average count of Snaplex queued Pipelines.
- Example: targetPlexQueueSize: 5
Where 5 is the number of queued Pipelines. - Leave this field empty to disable this metric.
- Example: targetPlexQueueSize: 5
- targetAvgCPUUtilization. The target utilization for average CPU utilization.
- Example.
targetAvgCPUUtilization: 50Where 50 is 50% - Leave this field empty to disable the metric.
- Example.
- targetAvgMemoryUtilization. The target utilization for for average memory utilization.
- Example:
targetAvgMemoryUtilization: 50Where 50 is 50% - Leave this field empty to disable the metric.
- Example:
- scaleUpStabilizationWindowSeconds. The window of time during scale up
If you leave this field empty, the default value is 0. - scaleDownStabilizationWindowSeconds. The window of time time scale down.
If you leave this field empty, the default value is 300. - terminationGracePeriodSeconds. The grace period in seconds after the Snaplex node termination signal and before a forced shutdown.
If you leave this field empty, the default value is 30 seconds.
- CPU and memory requests for the nodes.
- Install the Helm Chart by running the following command.
$ helm install -n snaplogic <helm_chart_folder> Verify the Helm Chart installation by running the following command.
Code Block $ kubectl get all -n snaplogic NAME READY STATUS RESTARTS AGE pod/<helm_chart_name>-snaplogic-snaplex-feedmaster-84ff4f48c-7rtpd 1/1 Running 0 12s pod/<helm_chart_name>-snaplogic-snaplex-jcc-66ddddcb76-ttdwz 1/1 Running 0 12s NAME TYPE CLUSTER-IP EXTERNAL-IP PORT(S) AGE service/<helm_chart_name>-snaplogic-snaplex-feed NodePort 10.100.83.252 <none> 8084:30456/TCP 13s service/<helm_chart_name>-snaplogic-snaplex-regular NodePort 10.100.140.124 <none> 8081:30182/TCP 13s NAME READY UP-TO-DATE AVAILABLE AGE deployment.apps/<helm_chart_name>-snaplogic-snaplex-feedmaster 1/1 1 1 13s deployment.apps/<helm_chart_name>-snaplogic-snaplex-jcc 1/1 1 1 13s NAME DESIRED CURRENT READY AGE replicaset.apps/<helm_chart_name>-snaplogic-snaplex-feedmaster-84ff4f48c 1 1 1 13s replicaset.apps/<helm_chart_name>-snaplogic-snaplex-jcc-66ddddcb76 1 1 1 13s NAME REFERENCE TARGETS MINPODS MAXPODS REPLICAS AGE horizontalpodautoscaler.autoscaling/<helm_chart_name>-snaplogic-snaplex-hpa Deployment/<helm_chart_name>-snaplogic-snaplex-jcc 10%/50% 1 5 0 13s
You can now monitor the scale up and scale down of your Groundplex node resources in Kubernetes. You can view View an example of a completed Helm Chart in the next section.
Sample Helm Chart Version 2 Configuration Values
The following Helm Chart shows example configuration values for Elastic Scaling of Snaplex instances. Download a sample template.
...
To understand the monitoring workflow for Elastic Scalingelastic scaling, see Monitoring your Snaplexes in a Kubernetes Environment.
Downloads
attachments
| View file |
|---|
|
|