...
The API dashboard wall displays API metrics that provide insights into your APIs. You can access the API dashboard wall from the subtab on the SnapLogic Dashboard. The API dashboard wall for your API Manager Developer Portal. The dashboard is composed of widgets that help you visualize various API metrics and details about the types of metrics that provide insights into your APIs. As an Org admin, you can monitor statistics that give a summary view of any selection of APIs within your Org. As a Pipeline API developer, you can track the consumption of your APIs, troubleshoot errors, and analyze performance (latency).
You can access the dashboard by clicking the API tab in the SnapLogic Dashboard. Similar to the functionalities available on the Pipeline and Tasks dashboard tabs, you can view assets to which you have read and write permissions. As an Org admin, you can also monitor statistics that give a summary view and details about the APIs (Ultra and Triggered Tasks) running in your Org.
Troubleshooting Errors
The API dashboard serves as the central repository of information about your APIs when they are published to and consumed from the developer portal. As an Org admin, you . You can collect metrics on usage, latency, and the number and type of errors API consumers face. This data collection is an important part of managing API policies , because understanding these metrics can help you decide on the combination of policies that best protect the APIs published to your developer portal. Because the dashboard supports downloads, you can collect these metrics over time and analyze the patterns for usage trends.
The dashboard separates response from target errors, making it easier to determine if the error occurred because of an API policy configuration or originated from the Pipeline runtime. Latency metrics facilitate fine-tuning the efficiency of your traffic control policies for your APIs. Furthermore, you can perform deep dive analysis from the dashboard, and easily access the Pipeline runtime of a target API. This capability allows API developers to fix issues at the Pipeline level and improve the service that the API provides.
...
The API dashboard renders API usage metrics in visual and detail statistical views. The API Details table lists the APIs that are handling the most requests. The order of target APIs defaults to requests per minute, essentially giving you a view of the top ten APIs. You can also sort by error percentage and latency, so that you can analyze problems your API consumers are facing when ingesting APIs from your developer portal. These details combined with the widgets give API developers the tools they need to analyze consumption trends and improve the user experience of their APIs.
...
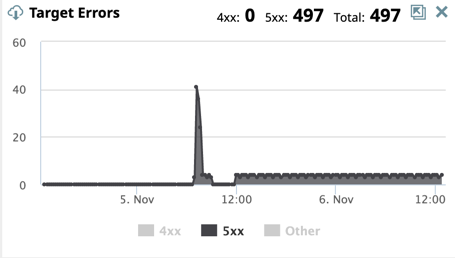
Target Errors: The 400 and 500 errors that occur during the Pipeline prepare state and execution phaserun.
Error Percentage: The errors that occur with the API calls as a percentage of the total number of requests. This metric indicates ineffective API design, weak API documentation, and/or even malicious actors accessing the API ecosystem.
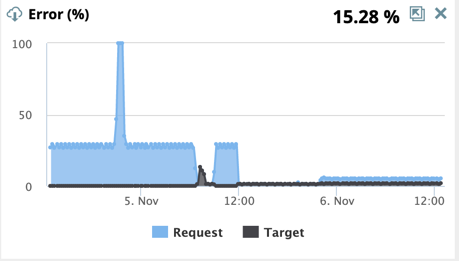
Request Errors: The errors that violate a policy or fail authentication, resulting in a canceled request. Pipelines are not prepared or executed in this scenario.
Target Errors: The errors that occur during the Pipeline prepare state and execution phaserun.
99 Percentile Latency: Latency is the number of milliseconds the API ecosystem takes to respond to a call. The 99p latency value means that 99 out of 100 API data samples fall below this value. This metric indicates the efficiency or the cycle - time of the API ecosystem.
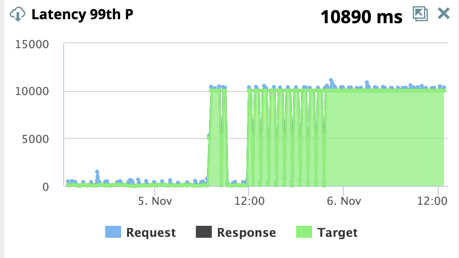
Request Latency: The time taken to link the Task definition, run API policies, and authenticate the request in milliseconds (ms).
Target Latency: The time taken to prepare and execute the Pipeline to completion in milliseconds (ms).
Response Latency: The time taken to collect statistics and process the response to the caller in milliseconds (ms).
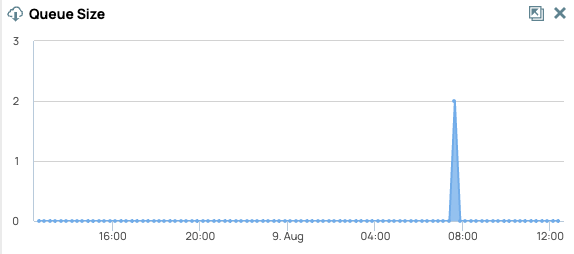
Queue Size: The number of requests waiting to be processed by your Ultra Tasks. The vertical access gives the number of requests in the queue, and the horizontal access is the timeline.
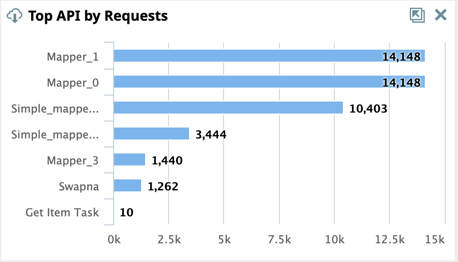
Top API by Request: The top 10 APIs in your Org by request.
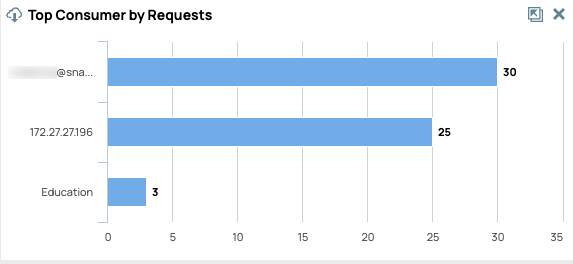
Top Consumer by Requests: The top number of requests by API consumer.
Selecting a Widget
To select/deselect the widgets to display on the Dashboard, click the Widget selector at on the top left .
...
side below the tabs:
...
Exploring the Widget
Within the graphs, you can position your cursor over the data points to view the metrics for that period of time. Data points represent the total or the average value over a 15-minute period. Sliding the cursor along the trend line on the widget also displays the data points for that area of the graph. You can further specify which metrics to view by clicking the labeled colored squares below the graph.
...
1 Hour: View the statistics for the last hour.
8 Hours: View the statistics for the last eight hours.
24 Hours: View the statistics for the last 24 hours.
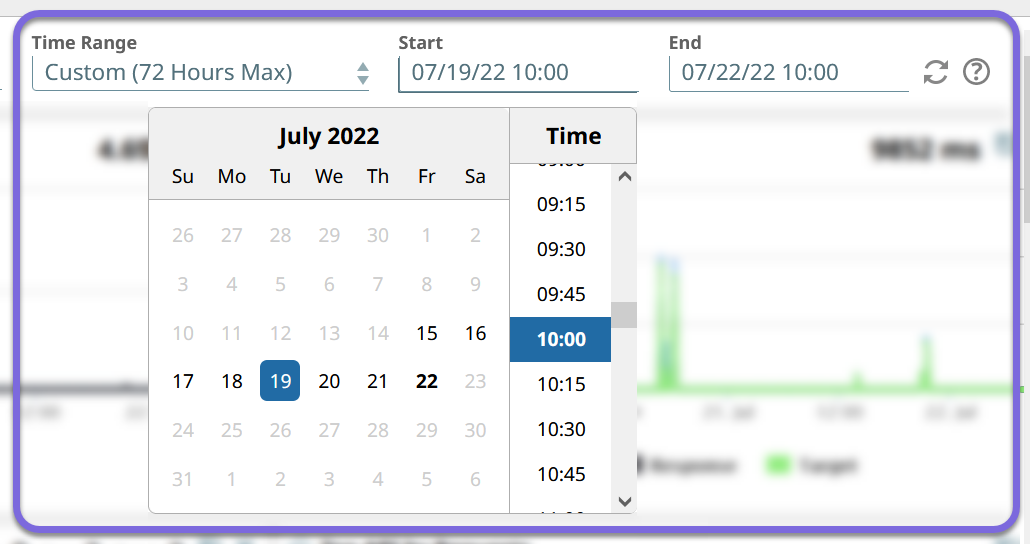
Custom: View the statistics for a target time period of days/hours, limited to the last seven days.
| Note |
|---|
...
Customized Date RangesWhen selecting the date range, the value for the End date is automatically adjusted to a maximum span of 72 hours once you choose the Start date. You cannot select a time period greater than 72 hours. |
...
Viewing and Hiding the Available Panels
You can view the metrics for each API in the specified period in the All API Details table. Clicking on the API call opens a separate window with details of that API.
...
| Info |
|---|
|
...
To view the API dashboard, click Dashboard > API. By default, SnapLogic displays data for the past hour.
Analyzing Request Details
...
You can analyze usage and other statistics in the All API Details widget.:
...
The widget lists all the APIs that were called from the Developer Portal.
To sort the list, click the column header:
Requests per Minute (RPM)
# Errors
Error (%)
Total Time99thP(ms)
Request Time Latency 99th P (ms)
Wait Time 99th P (ms)
Target Time 99th P (ms)
To download a CSV summary of the information, click
 .
. To display the API Task Details, click
or next to the API name.To display the API Request Details, click the API name.
The Total Time is now divided into Request, Wait, and Target Times. This breakdown enables you to troubleshoot where issues are occurring with failed requests. For example, a delay between Request and Wait times for requests that result in errors could originate from a policy configuration issue.
API Request Details
The request details view details table provides additional information about API requests.
To view the API Details, click on the specific API:
...
Click the Back button to return to the All API Details view.
...
Below are the field description of the API Request Detail Table:
Field Type | Description |
|---|---|
Time | When the API was |
...
invoked. | |
AuthN | The authentication type used for the request, if applicable. |
Client/ |
...
Username | The client identifier |
...
(IP address of the requester |
...
) or the username (ID used for authentication). |
Role |
...
User role, if applicable. | |
Remote Address | The client IP of the API invoker. |
Request Method |
...
The HTTP method of the API call. | |
Path Info |
...
The name of the path. |
...
AuthN: The authentication type used for the request, if applicable.
...
Status | The HTTP status code. The T or R indicates whether the status is from the |
...
Target (T) or the |
...
Request (R). |
Resp Time (ms) |
...
The number of milliseconds from the time the request is received to the time the response is sent. |
Click Back to return to the All API Details view.
...