Dashboard is a reporting interface that provides information on pipeline Pipeline runs and Snaplexes.
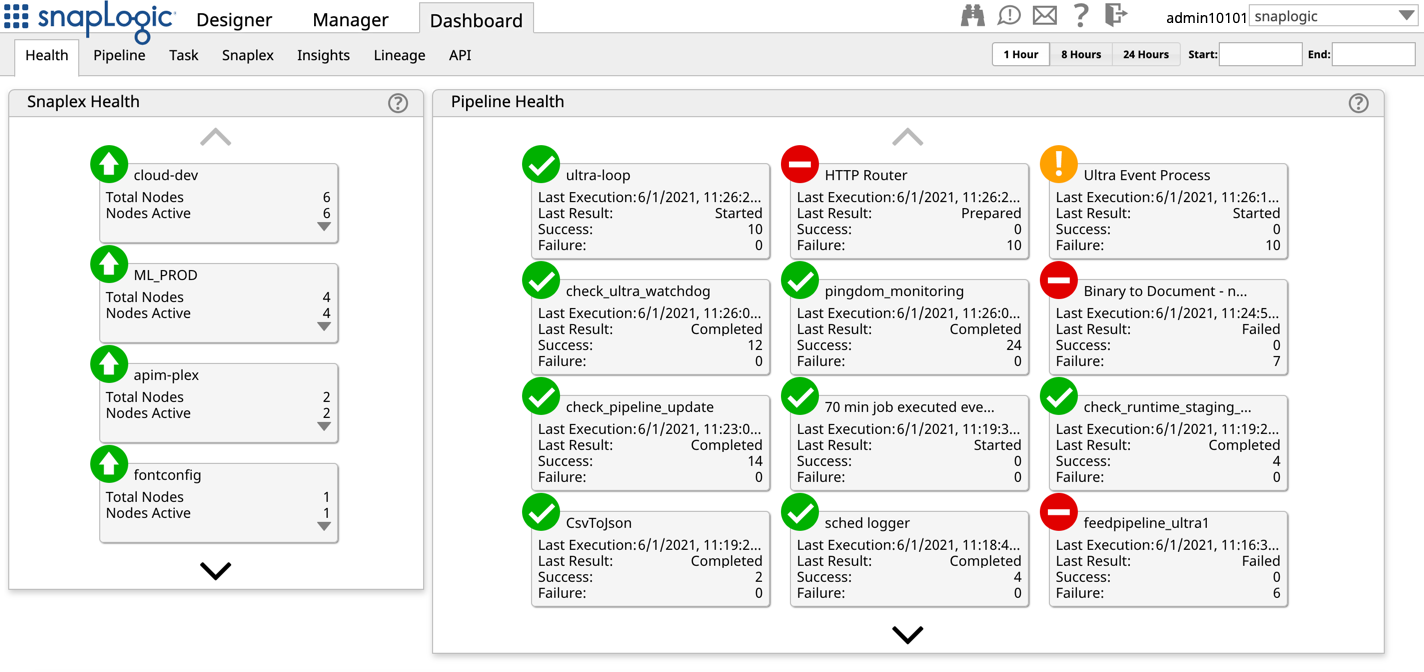
The Health wall displays the Snaplexes available, whether they are up or down and their CPU and memory usage. Green instances are running, yellow were shut down gracefully, and red indicates a system crash.
The Pipeline wall displays the Pipeline Run History, including the run status, run time, and duration.
The Task dashboard offers details on the execution status of Scheduled and Triggered tasks for a specific time range.
The Snaplex wall displays graphs for active pipelines, executed pipelines, active nodes, and pipeline distribution. You can change the duration displayed in each graph by selecting the duration buttons and select data for specific nodes.
...
Available only to org admins, the Insights dashboard offers interactive graphs that help you visualize Org-level Pipeline-execution statistics for a specific date range.
...
See Also
...