| Panel | ||
|---|---|---|
| ||
This page is no longer maintained (March 29, 2023). For the most current information, go to Analyze and Monitor Studio. |
| Redirect | ||||||
|---|---|---|---|---|---|---|
|
On this page:
| Table of Contents |
|---|
...
Overview
Pipelines contain the logic to integrate and transform data. Tasks execute Pipelines on a schedule, in response to an HTTP or API call, or in the case of Ultra Tasks, in response to streaming data. Information on Pipeline execution is valuable for troubleshooting and fine-tuning performance during the development cycle and in production.
The Execution overview page displays a list of Pipeline and Task executions. You can see who executed them, when they started and finished, how long execution took, their status, and how many documents were processedreports on Pipeline executions for the selected time period. From this page, you can determine:
Which Pipelines are currently executing
Who executed a Pipeline
Which Task executed a Pipeline
What time an execution started and finished
Current and past execution status
How many documents were processed during an execution
What type of errors occurred
Optional columns contain the following information:
The Project Space and Project to which a Task belongs
The Snaplex and node that executed the Pipeline
Analyzing Pipeline Execution
In SnapLogic Studio, click Analyze > Execution to open the Execution overview:
...
Each row shows details for a Pipeline execution. Using controls on the Execution overview page, you can:
Select a time period in hours or by date range.
View execution status summary cards for the selected time period. Filter Click a card to filter the execution table list by that status.
Click a Pipeline or Task to view its details. Learn more about Execution details.
SearchAggregate executions, grouped by Pipeline or by the Tasks that triggered them.
Resize, search, filter, and add or remove columns from the execution list.
Click a column name to sort the execution tablelist by ascending or descending values.
Export the current results to a CSV file.
Refresh the execution tablelist.
Sort the execution table by a column.
In SnapLogic Studio, click Analyze > Execution to open the Execution overview:
...
The Execution overview page contains the following elements and controls, starting at the top left side of the screen:
...
Callout
...
Element
...
Description
...
1
...
...
Admins and users with accounts on multiple Orgs can use this pull-down to switch between Orgs.
...
2
...
...
Use the dropdown by your name to return to the existing interface or logout.
...
3
...
Use the dropdown menu to filter the executions displayed in the table by hour periods or a by a date range.
...
4
...
...
Execution summary cards display the number of Pipeline and Task executions by status:
Failed. Total executions that failed during selected time period.
Executing. Total executions currently running.
Completed. Total executions that completed with and without warnings during selected time period.
Ultra Executions. Total Ultra Tasks during selected time period, including failed runs and successful runs.
| Info |
|---|
Tips:
|

...
5
...
...
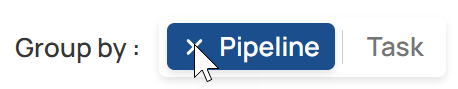
Group by options filter the executions shown in the table by Pipeline or Task:
To view only one category of executions, click Pipeline or Task.
To remove the filter and view both categories, click X or the highlighted group:
...
6
...
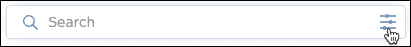
Search the execution list, click the options icon to:
Filter the execution list.
Add, remove, and rearrange execution table columns.
...
7
...
From left to right, table toolbar buttons provide the following functionality:
Download to a CSV file on your local machine.
Refresh the execution list.
Show or hide the summary card panel.
...
8
...
View and manage the list of executions:
View details of an execution by clicking it. Learn more: Execution Detail.
Sort the table by clicking column headers.
Copy a value in the table to the clipboard, by hovering over a cell and clicking the copy icon (
 ).
).Below execution rows:
View the time that the list was last refreshed.
Change the number of items displayed on each page.
Navigate to the previous page, the next page, or a specific page number.
| Info |
|---|
Tips:
|
...
9
...
Expand or collapse navigation panel.
...
10
...
Page through executions and select how many to show per page.
Use Cases
The following examples describe how to use the Execution overview page for troubleshooting and analysis:
...
...
...
...
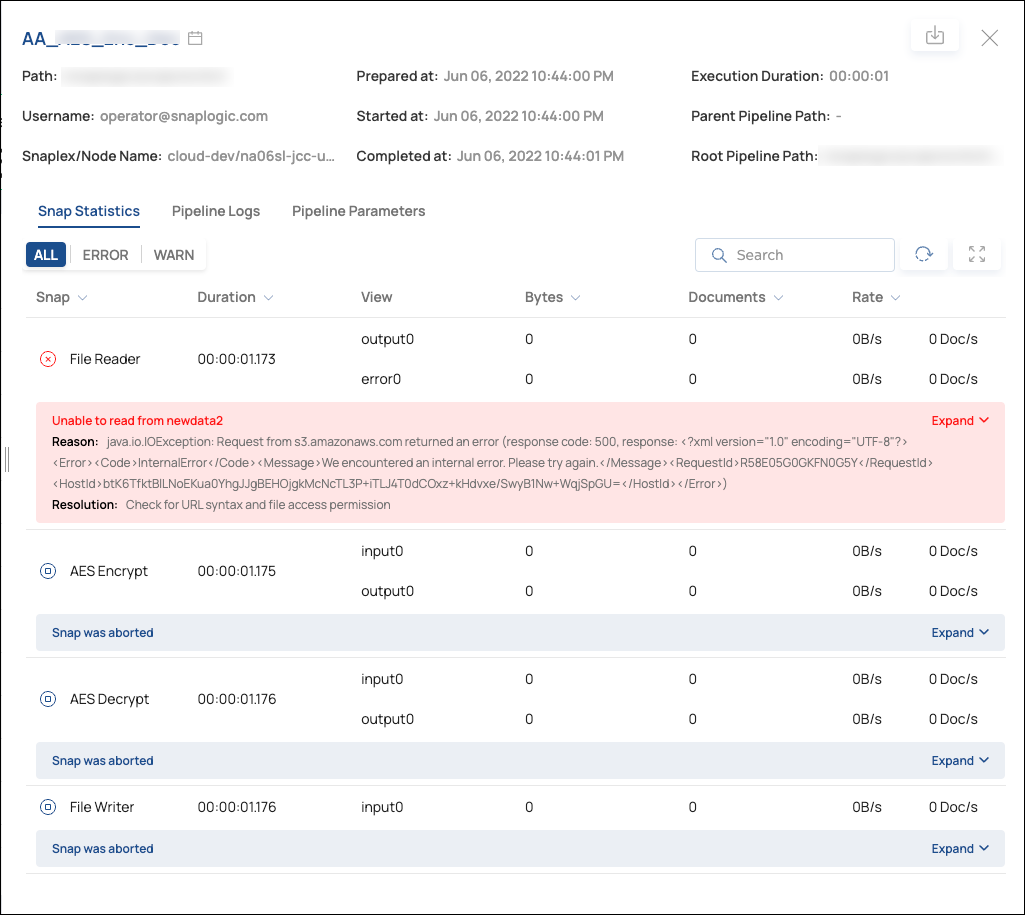
Click an execution to view its details. Pipeline execution details include information on its Snaps and parameters, and give you access to errors and logs. For each Snap, you can determine how long it took, how much data and the number of documents that were processed, and at what speed. Learn more about Execution details.
The following Pipeline details panel shows an execution that completed successfully:
...
Finding Executions of Interest
Your Org might execute tens of thousands of Pipelines in a short time period. The Execution overview page provides controls for finding the executions of interest and viewing relevant details. Before using these controls, you can set the time period to the smallest window possible to reduce the number of executions in the list. After you run a search, the page URL contains the search string, filters, and column preferences. You can bookmark the URL to perform the same search later or copy it to share with colleagues.
The following sections provide procedures for:
| Anchor | ||||
|---|---|---|---|---|
|
To view your Pipeline executions:
In the Search bar, click the options icon:
In Advanced Options, click Executed by and start entering your username.
When your username displays, click + to select it.
Click Apply.
The execution list updates to reflect the filter. The options icon has a red decorator to indicate a filter was applied. The filter remains until you remove it.
| Anchor | ||||
|---|---|---|---|---|
|
To view the details of a failed Pipeline or Task:
Click the Failed summary card:
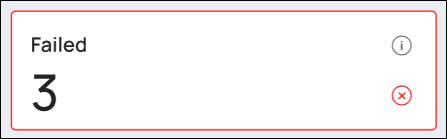
In the execution list, click the Pipeline or Task of interest to display details.
| Anchor | ||||
|---|---|---|---|---|
|
To use advanced filtering:
In the Search bar, click the options icon to display the Advanced filtering dialog:
...
In Advanced filtering, click the type of filter to apply.
The first filters in the menu have pull-down options:
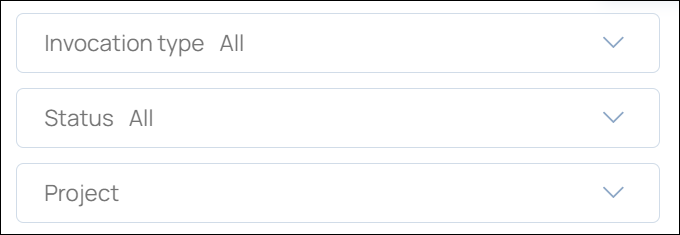
The
...
last filters in the menu accept text entries:
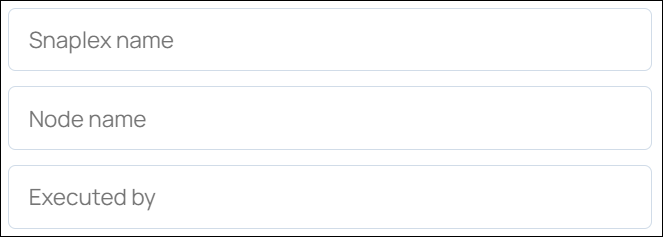
Add
...
filters
...
and click Apply.
The filters apply to subsequent searches and to the execution table list until you remove them. A red dot decorates the options icon to remind you that filters are applied.
Using Project Search
To find executions for a Project:
In the Search bar, click the options icon to display the Advanced filtering dialog:
In Advanced filtering, click the type of filter to apply.
Click Project to open the list of Project Spaces:
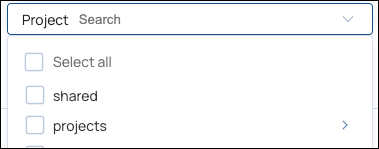
Click a Project Space to open the list of Projects:
Select the Project to search.
Viewing and Analyzing Execution Details
The following sections provide procedures for using the Execution overview for analysis and troubleshooting. Before using these controls, you can also set the time period to the smallest window possible to reduce the number of executions in the list.
| Anchor | ||||
|---|---|---|---|---|
|
Specific execution details might be of particular interest to you, such as the duration and completion status. You can resize, rearrange, add, and remove columns from the execution list to more easily scan relevant information.
To add, remove, and rearrange execution table columns:
In the Search bar, click the options icon:
...
The Advanced filtering dialog displays.
In the Column Preferences section:
Click x on a shaded column to remove it.
Click + on an unshaded column to add it.
Drag shaded columns to rearrange the order in which they display in the table.
Click Apply.
| Anchor |
|---|
...
To view your Pipeline and Task executions:
In the Search bar, click the options icon:

In Advanced Options, click Executed by and start entering your username.
When your username displays, click + to select it.
Click Apply.
The execution table updates to show your executions. The filter remains until you remove it.
...
To view the details of a failed Pipeline or Task:
...
Click the Failed summary card:
...
|
Instead of single executions, you might be interested in a series of executions to analyze behavior over a specific time period. You can group the execution list by Pipeline to aggregate information for a Pipeline, which could have been executed by multiple Tasks, or by Task to show multiple executions of the same Pipeline.
The Group by: control aggregates executions by Pipelines or by the Tasks that initiated them. To aggregate executions, follow these steps:
Next to Group by:, click Pipeline or Task.
The execution list displays Pipelines or Tasks.Locate the Pipeline or Task of interest and click it.
The details panel displays a list of Pipeline executions. This aggregated Pipeline example is sorted by Status to show failed executions at the top: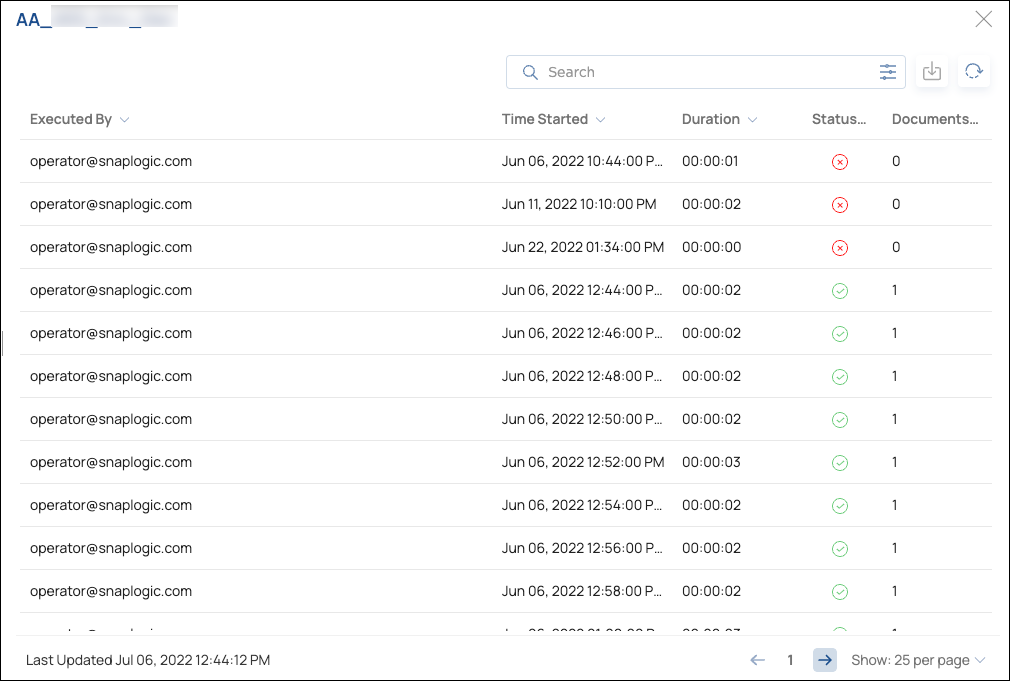
Click an execution to view the Pipeline details:
To return to the unaggregated list of executions, click the selected Pipeline or Task button to clear it.