On this Page
Pipeline Execution Details
The Execution overview page contains a table of executions. Click a Pipeline to view its details, including Snap statistics, logs, and parameters:

The following table describes the numbered callouts shown in the image:
Callout | Element | Description |
|---|---|---|
1 |  | Invocation types include:
|
2 |
| The Download menu gives you the option to Download logs only or to Download full runtime dump. |
3 | 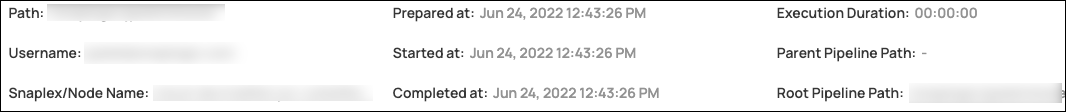 | The heading includes:
|
4 |  | Detail tabs provide more information about Snaps, logs, and Pipeline Parameters. Learn more about:
|
5 |  | From left to right:
|
Snap Statistics Tab
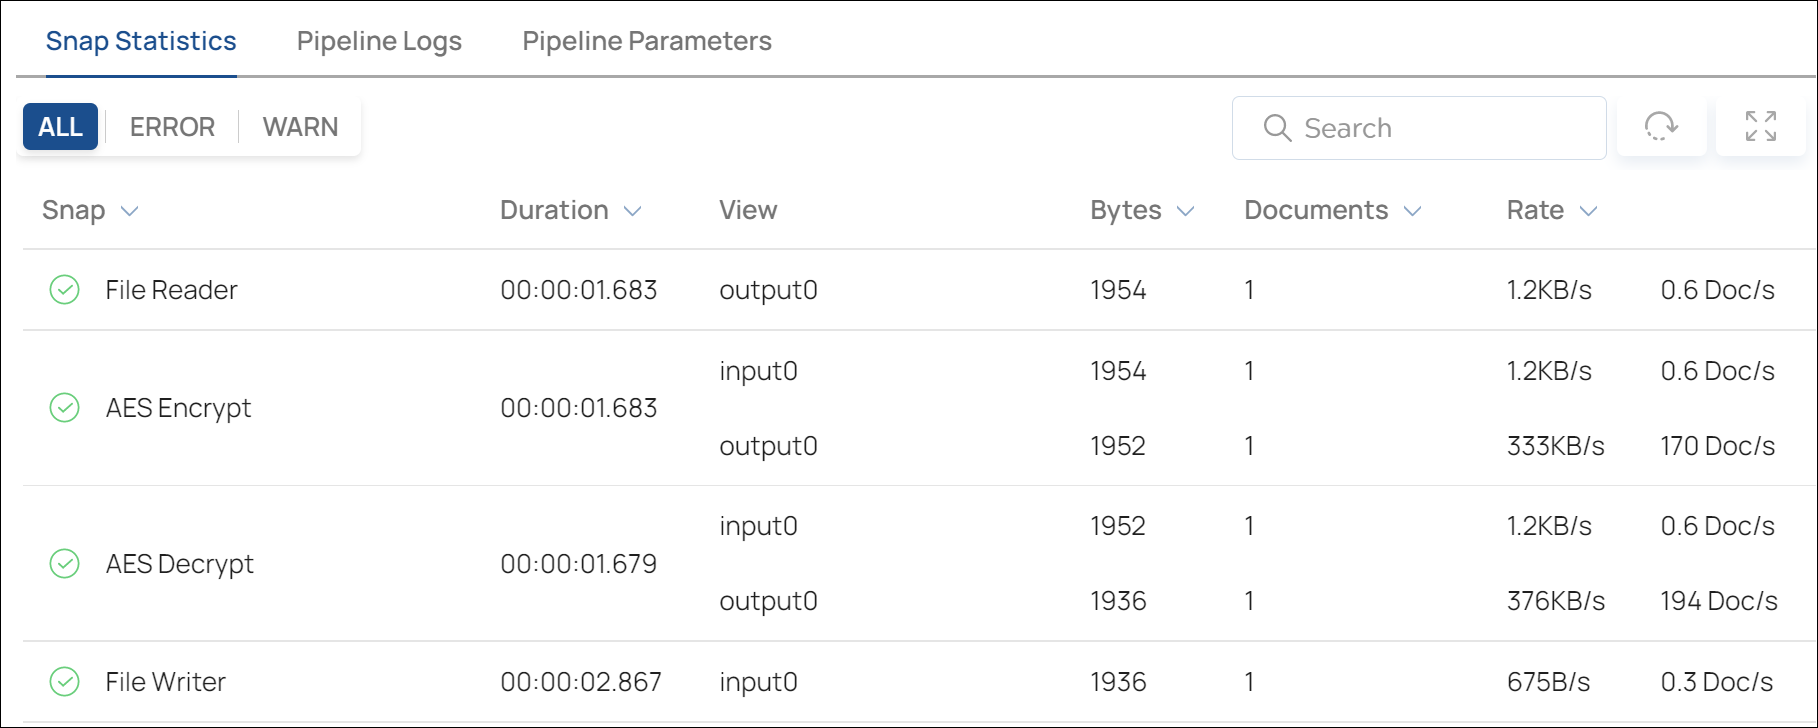
The Snap Statistics tab shows information about each Snap included in the execution.
The following table describes fields in the Snap Statistics tab:
Field | Description |
|---|---|
Snap | The name of the Snaps that were executed. |
Duration | The amount of time it took to execute a Snap. |
View | The name of an input or output port of the Snap. The data in the Bytes, Documents, and Rate columns are associated with the indicated View. |
Bytes | The number of bytes that passed through the indicated View. |
Documents | The number of documents that passed through the indicated View. |
Rate | The throughput of the indicated View (the number of documents that passed through per second). |
Pipeline Logs
The Pipeline Logs tab shows the log entries that were generated during the Execution.

The following table describes the fields on the Pipeline Logs tab:
Filter | Includes |
|---|---|
All | All log entries associated with the execution. |
Info | Only informational messages. |
Warn | Only warning messages during the execution. |
Error | Only error messages that occurred during the execution. |
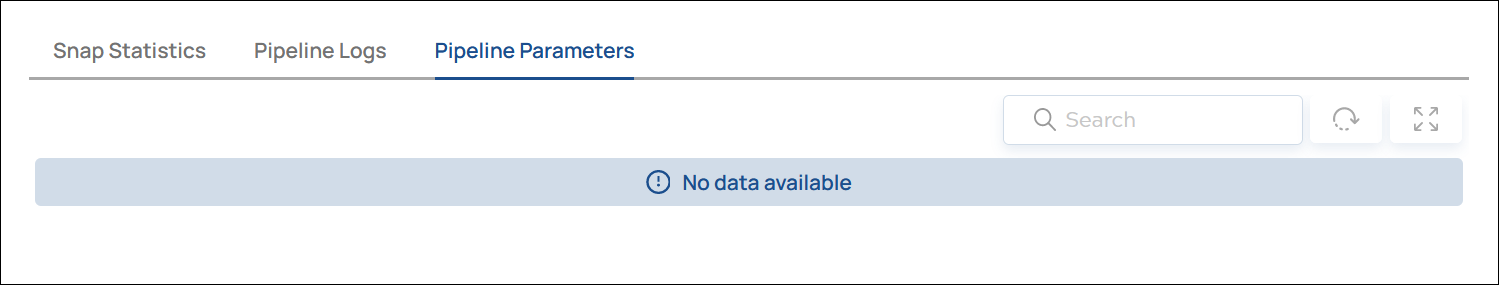
Pipeline Parameters Tab
The Pipeline Parameters tab shows information about the parameters passed to the Pipeline. The following example has no parameters.
Learn more: Pipeline Properties