In this article
| Table of Contents | ||||
|---|---|---|---|---|
|
Monitor Ultra Pipelines
You can monitor the Tasks based on your Ultra Pipelines in the SnapLogic Dashboard.
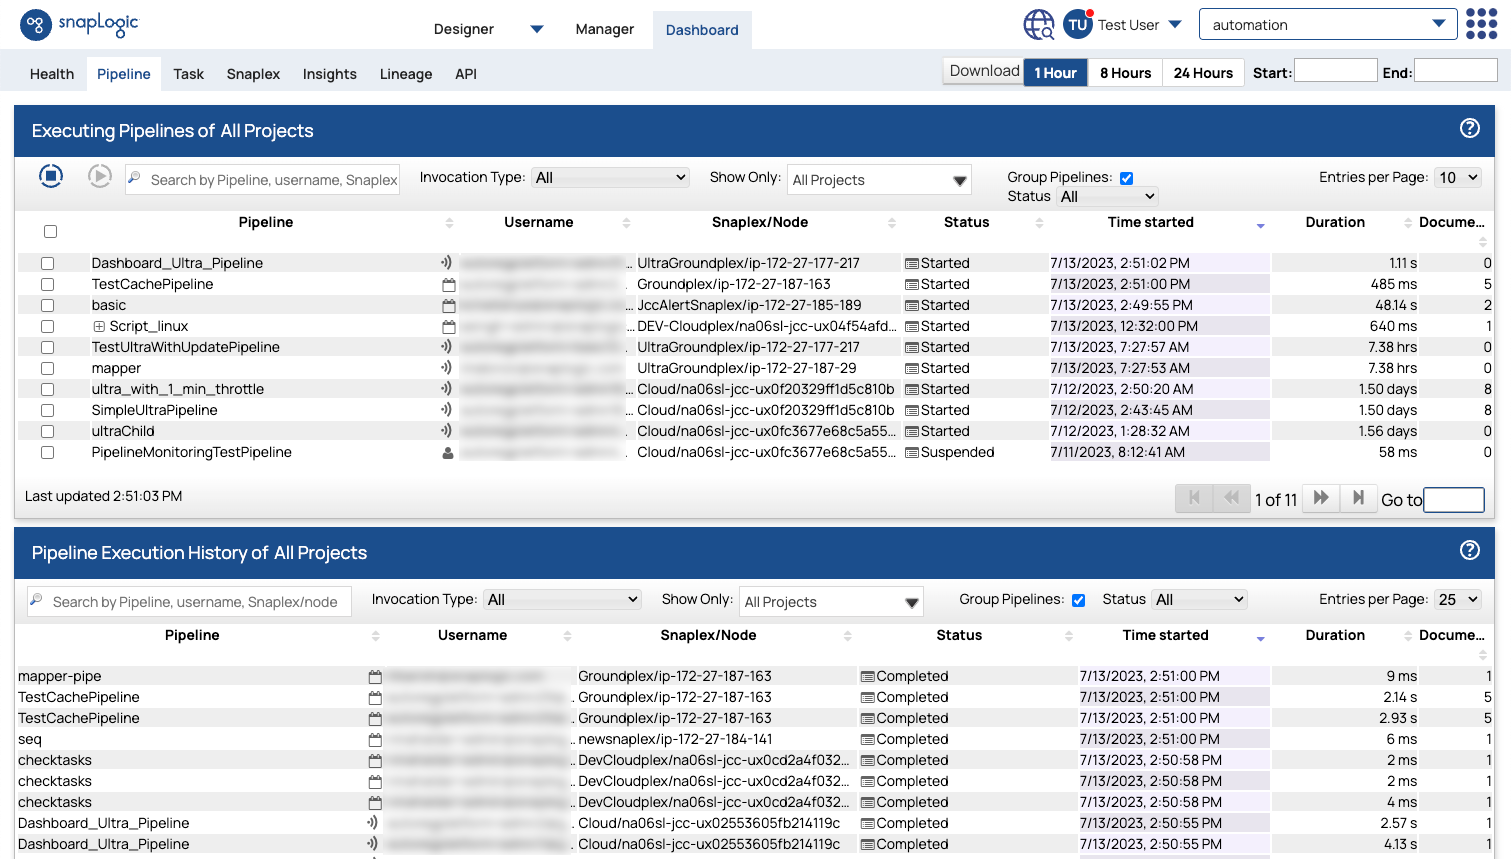
The dashboard displays a high-level snapshot of each Task:
- Pipeline: Name of the pipeline. Click
 to display the pipeline Task details in SnapLogic Manager in a new window.
 - Username: User who created the Task for the Pipeline.
- Snaplex/Node: Node on which the Pipeline runs.
- Status: Current status of the Pipeline Task.
- Time: Time when the Pipeline Task started.Duration
- Documents: Period of time that the Pipeline Task has been running. Hover Number of documents processed.
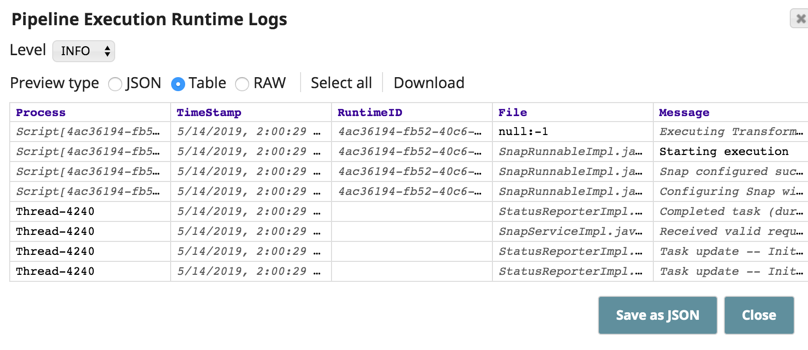
To display the following details about Pipeline Execution Runtime Logs for each Task, click ![]() in the status column.
in the status column.
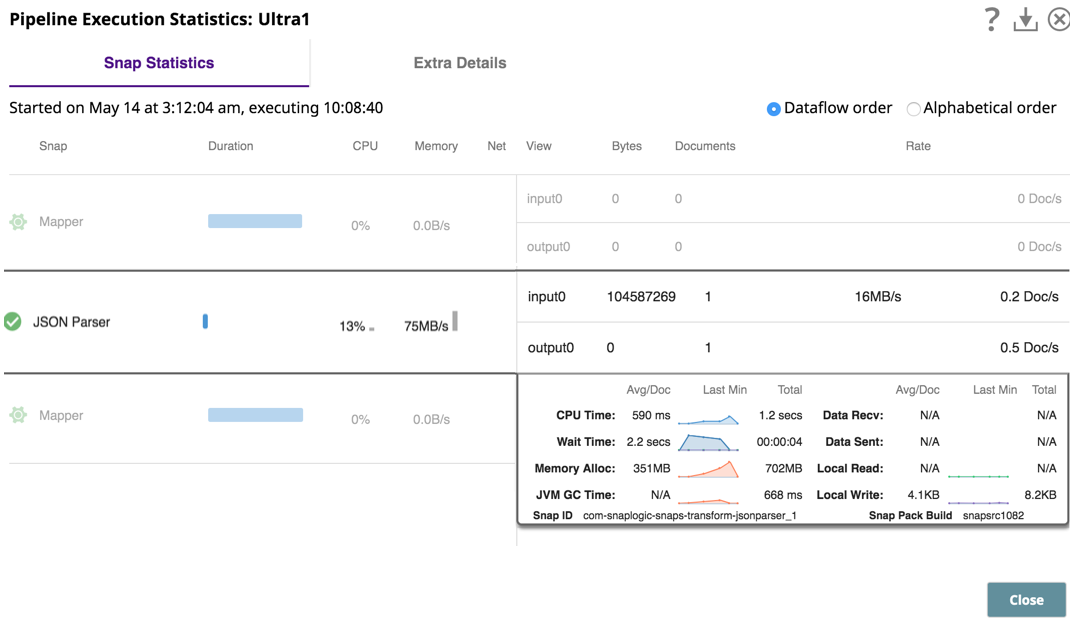
To view statistics regarding the running Ultra Pipeline, click the Status (Started, Stopped, Failed). Hover over the duration bar to view the following statistics:
Duration: Period of time that the Pipeline Task has been running.
- Idle Time: The time during which the Ultra Pipeline is Snaplex was idle.
- Execution Time: The time during which the Ultra Pipeline executed.
- Total Time: The combined time of both idle and execution times.Documents: Number of documents processed.
To display the following details about Pipeline Execution Runtime Logs for each Task, click ![]() in the status column.
in the status column.
To view statistics regarding the running Ultra Pipeline, click the Status (Started, Stopped, Failed).
view additional information about the Ultra Pipeline, click the Extra Details tab.
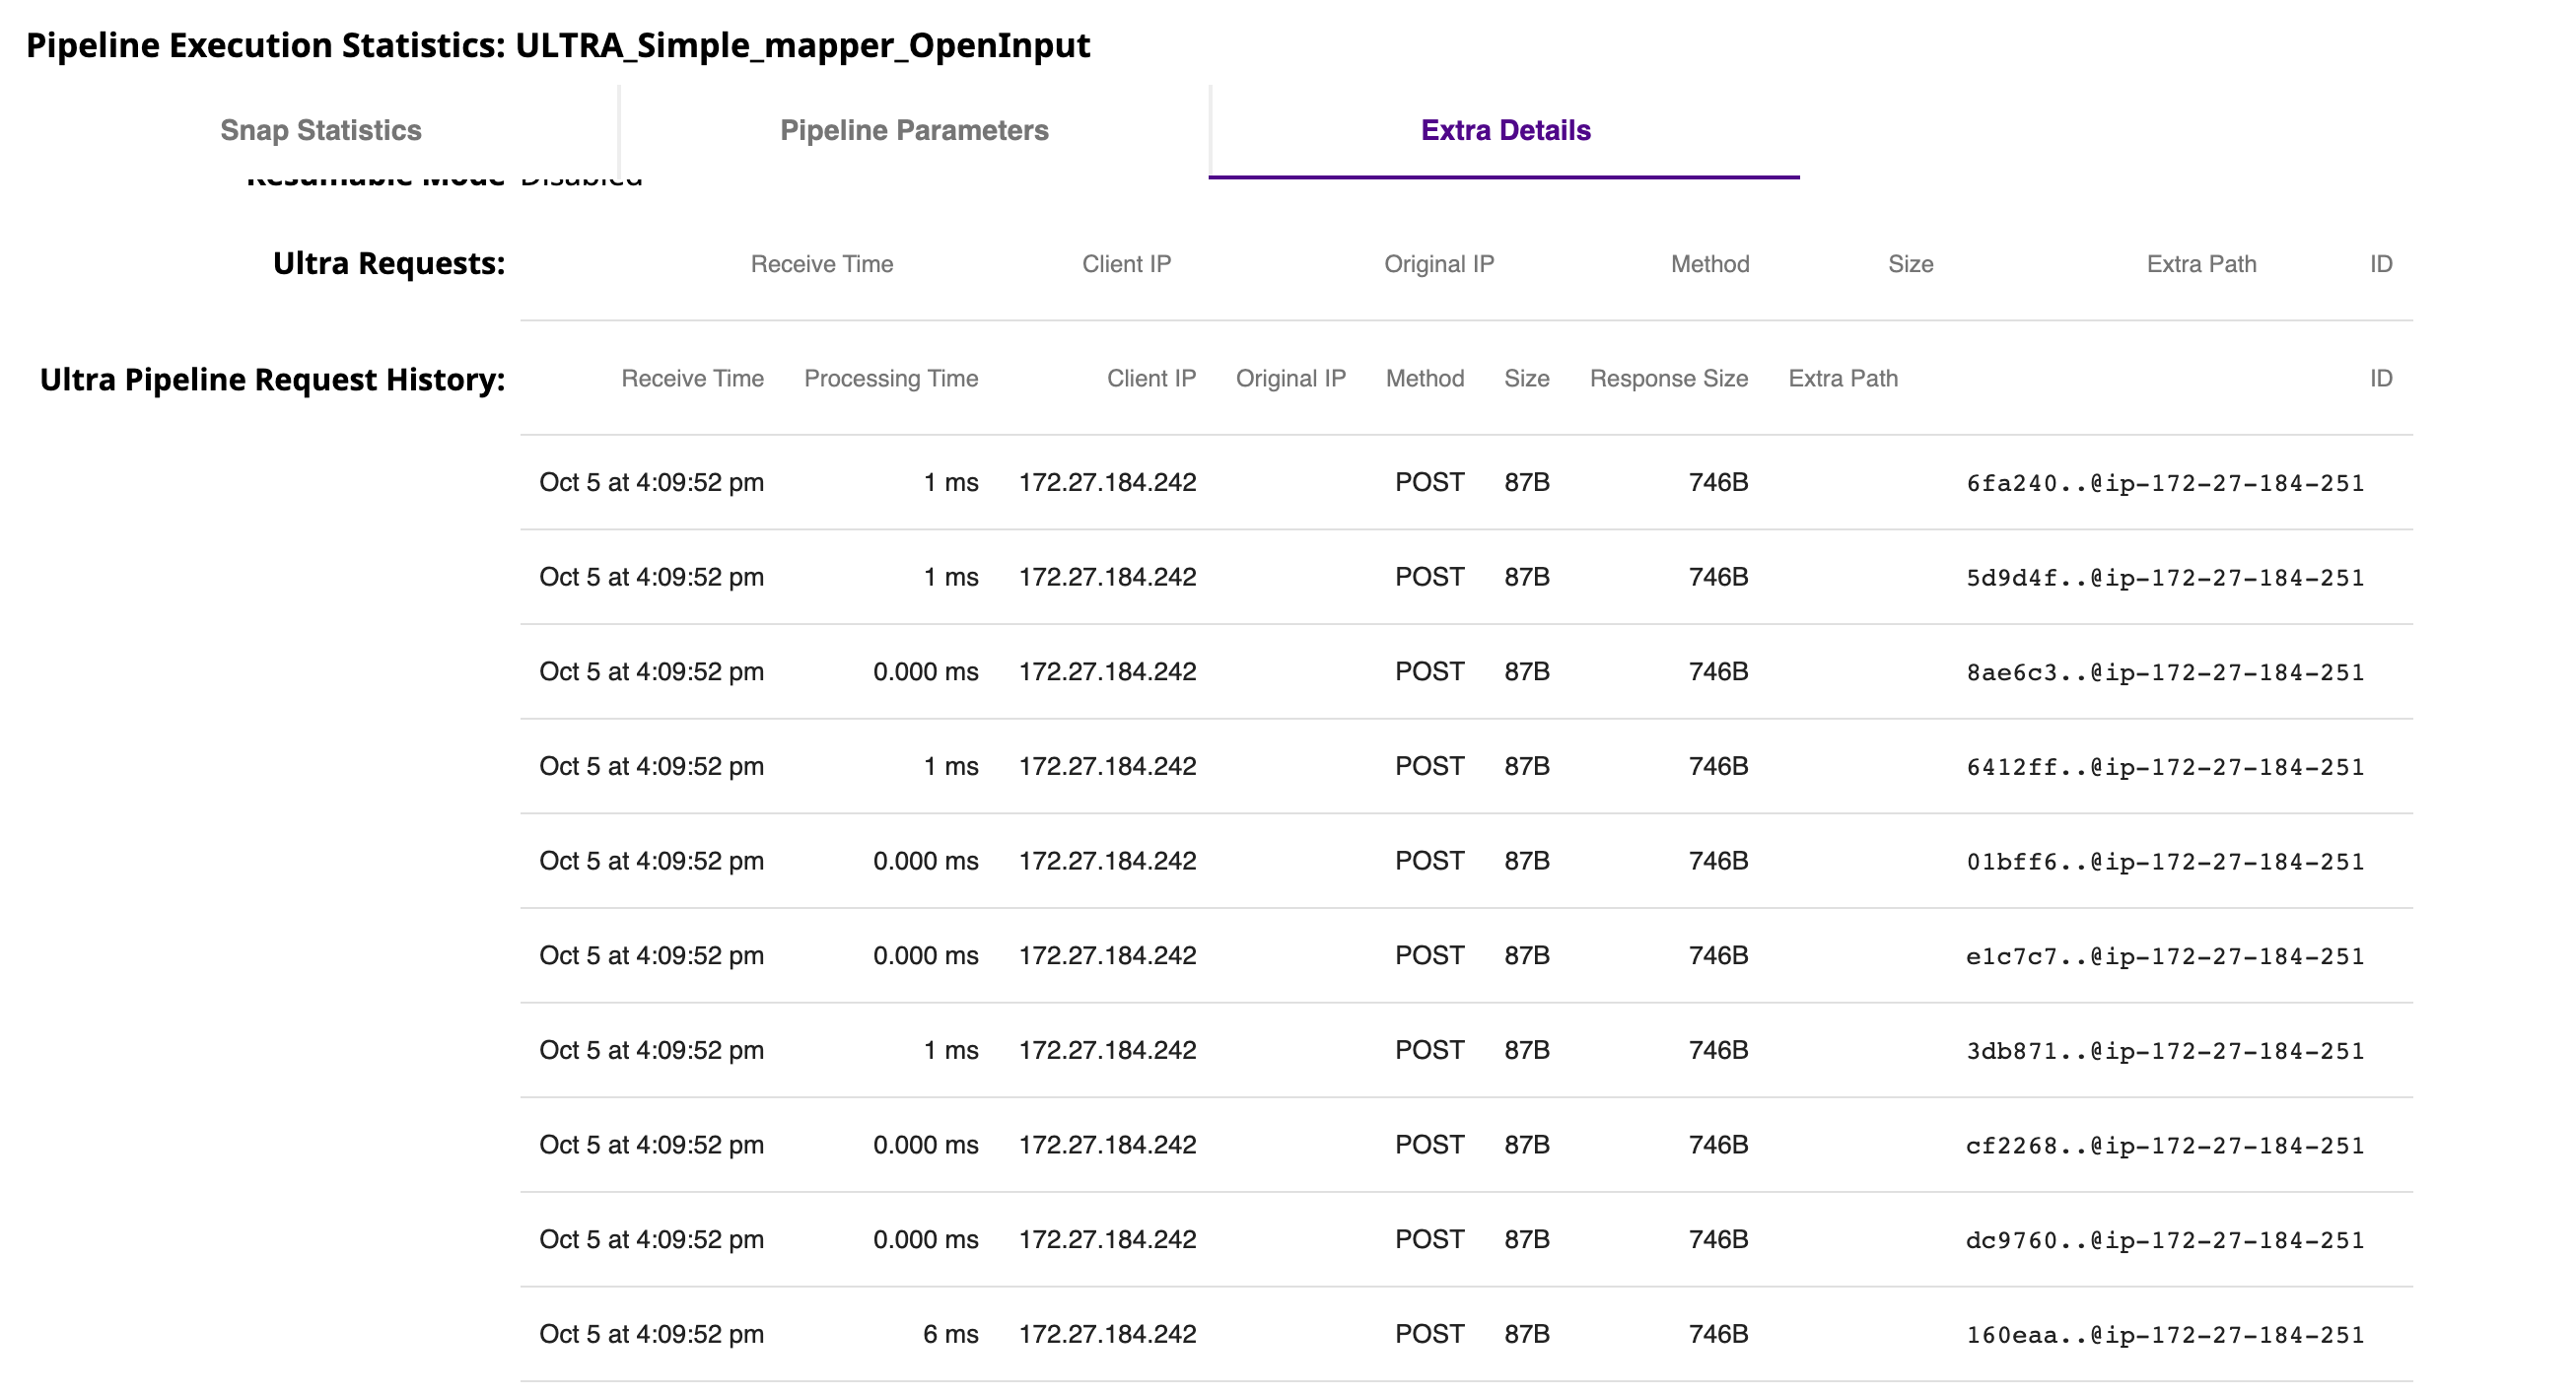
The Ultra Requests table shows the requests that are currently being processed by the Ultra instance. The Ultra Pipeline Request History table shows the most recent requests that the Ultra instance has processed. The tables have the same information:
Receive Time: The time a FeedMaster received the request.
Client IP: The IP address of the client making the request.
Method: The HTTP method of the request.
Size: The size of the request body.
Response Size: The size of the response body.
Extra Path: Any additional path elements that the request passed as part of the request.
ID: An unique identifier associated with the processed document.
If your Ultra Pipeline has a child Pipeline associated with it, the parent Pipeline has a ![]() icon, which you can click to expand. Click
icon, which you can click to expand. Click ![]() icon to view information.
icon to view information.
Monitor Snaplex Nodes and FeedMaster
On the Health tab, click the Snaplex where the Ultra Pipeline is running. 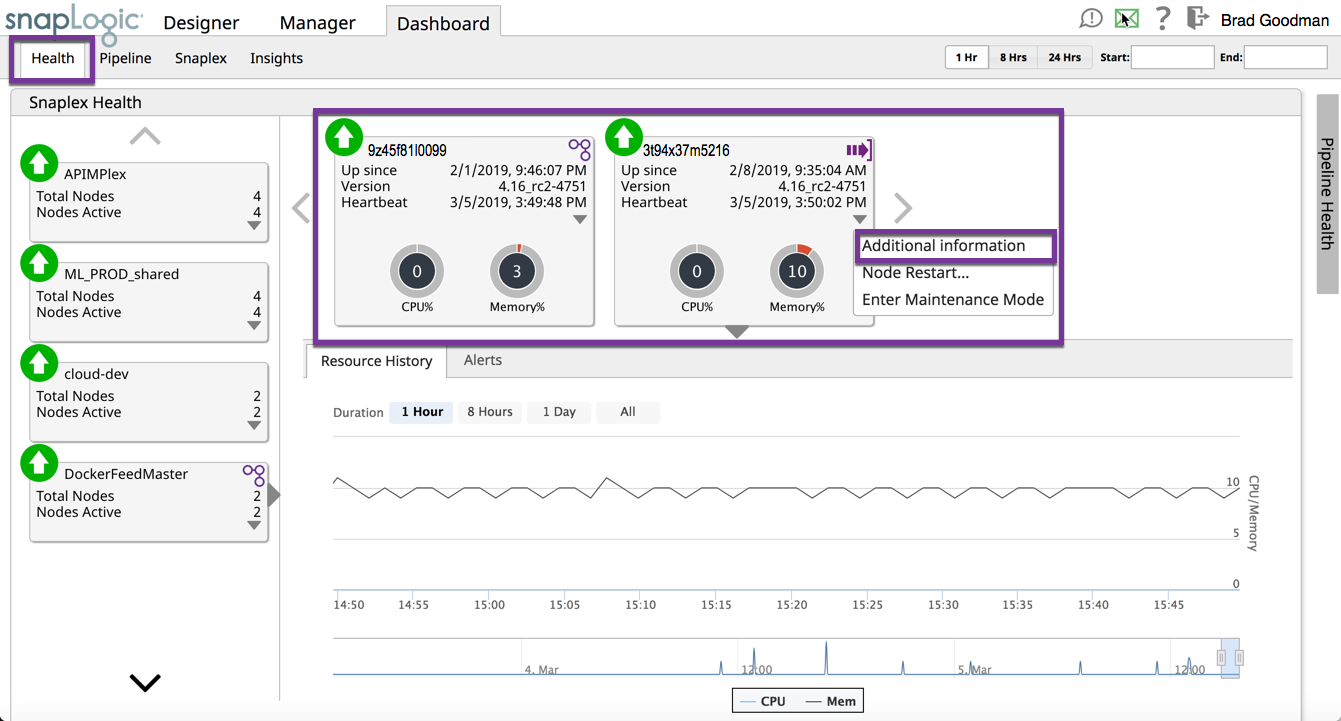 Click the arrow on a node to open the options menu:
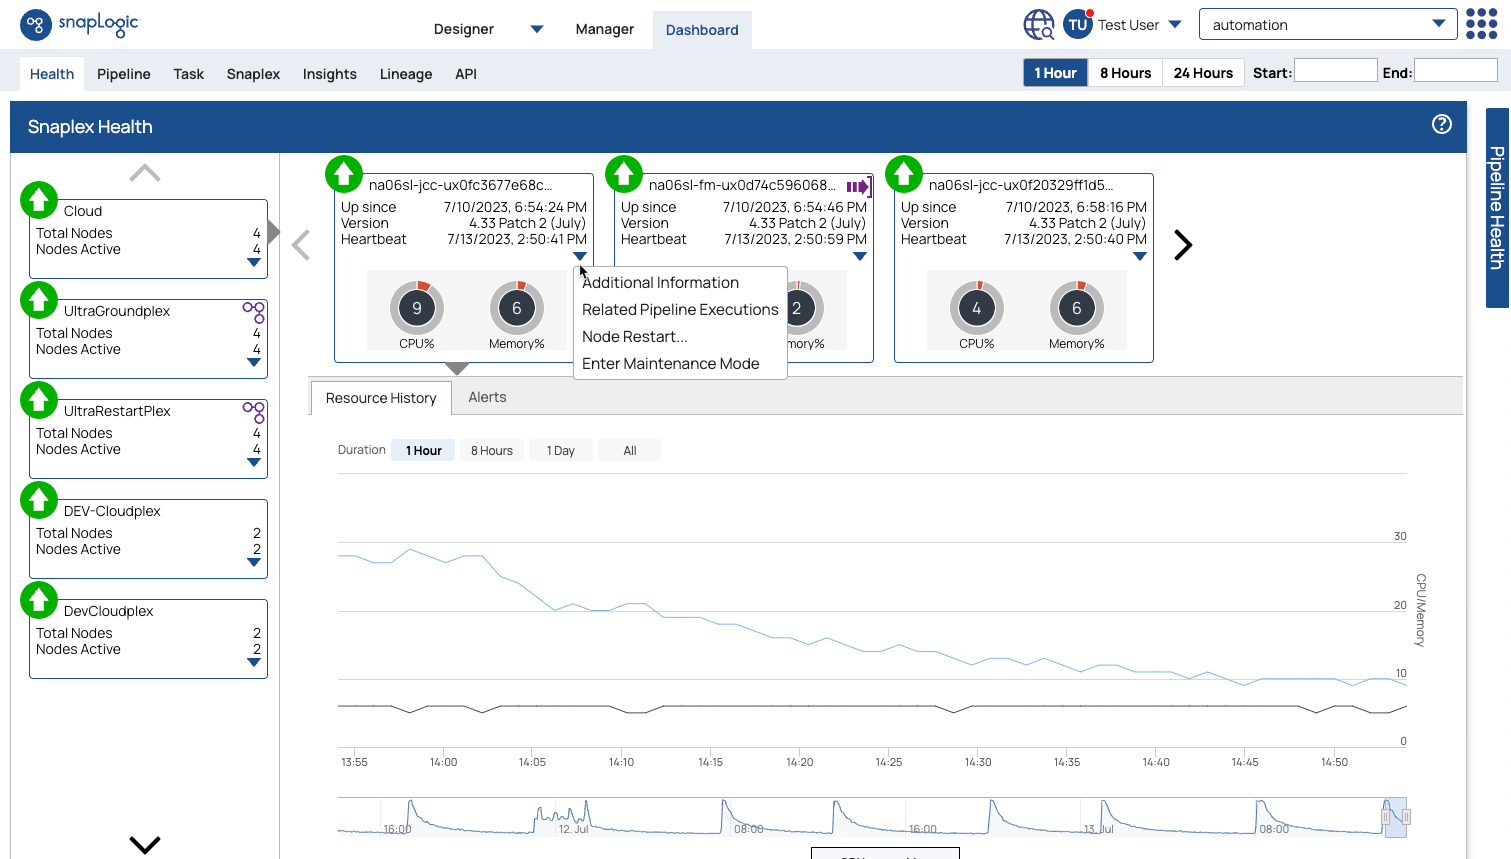
From this view you can monitor the Snaplex and FeedMaster nodes:
- Up Since (duration of the Pipeline run since invocation)
- Version (Snaplex)
- CPU usage
- Memory
- Heartbeat
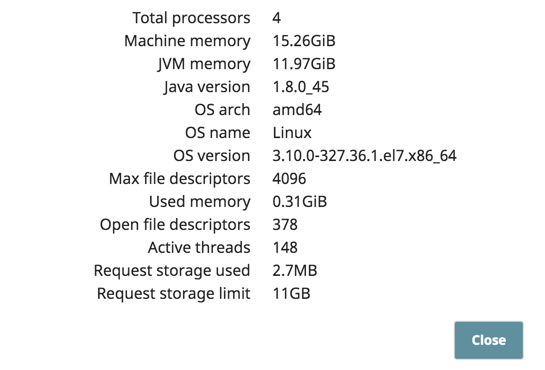
For FeedMaster nodes, select click the inverted arrow next to a node and click select Additional Information to display the hardware configuration and the requests that are in-progress.