Dashboard Health Wall
In this Page
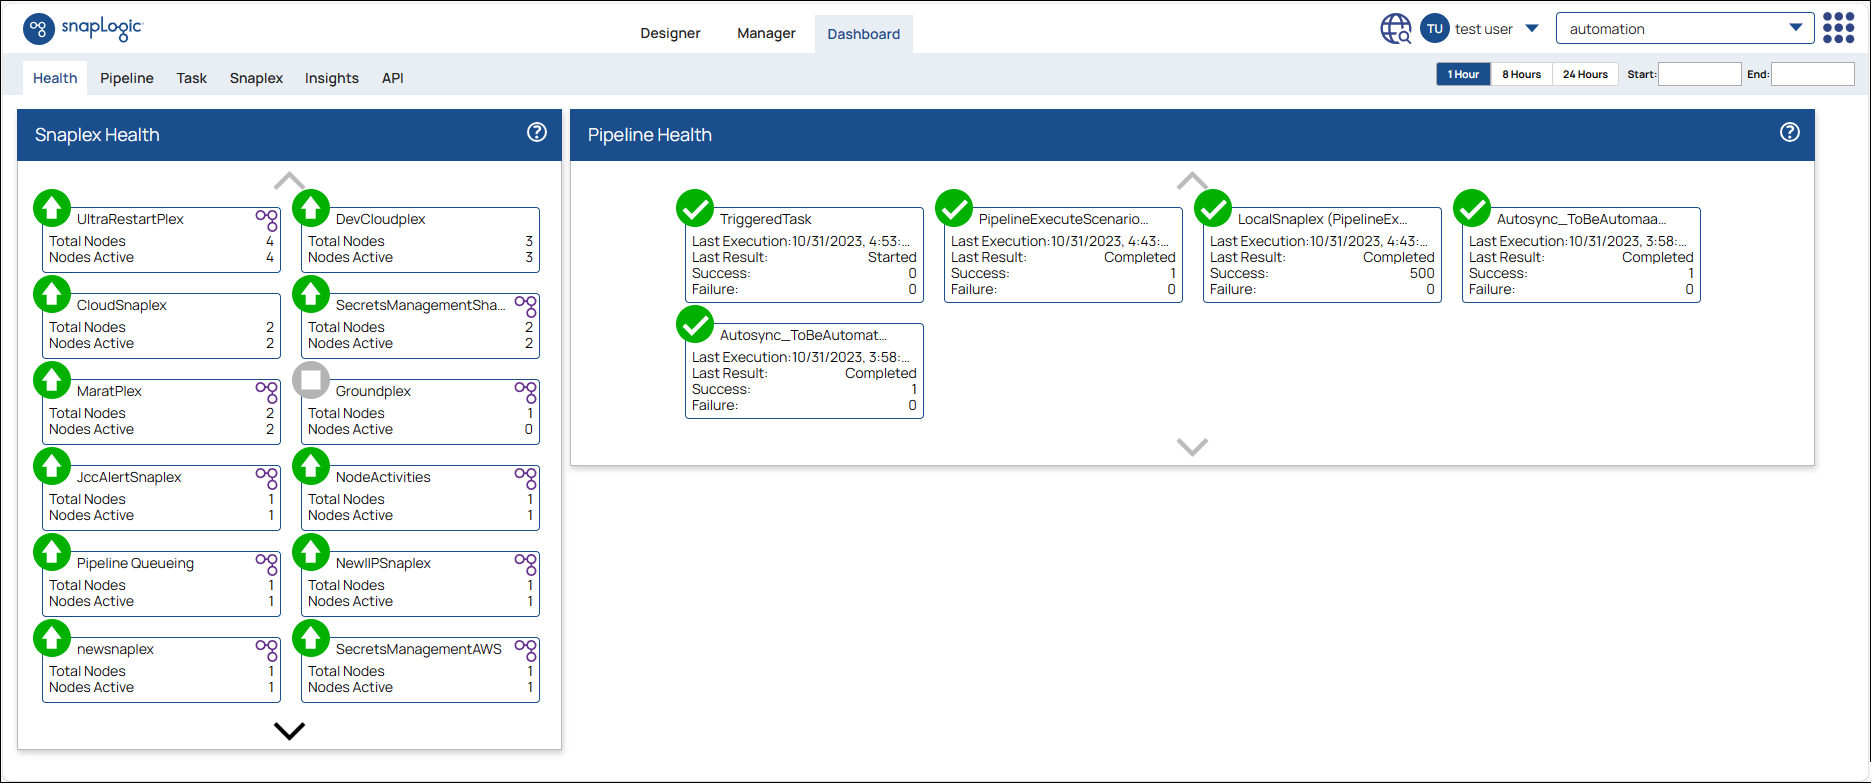
The Health wall displays information on the Snaplex instances available and the Pipeline run history.
Snaplex Health
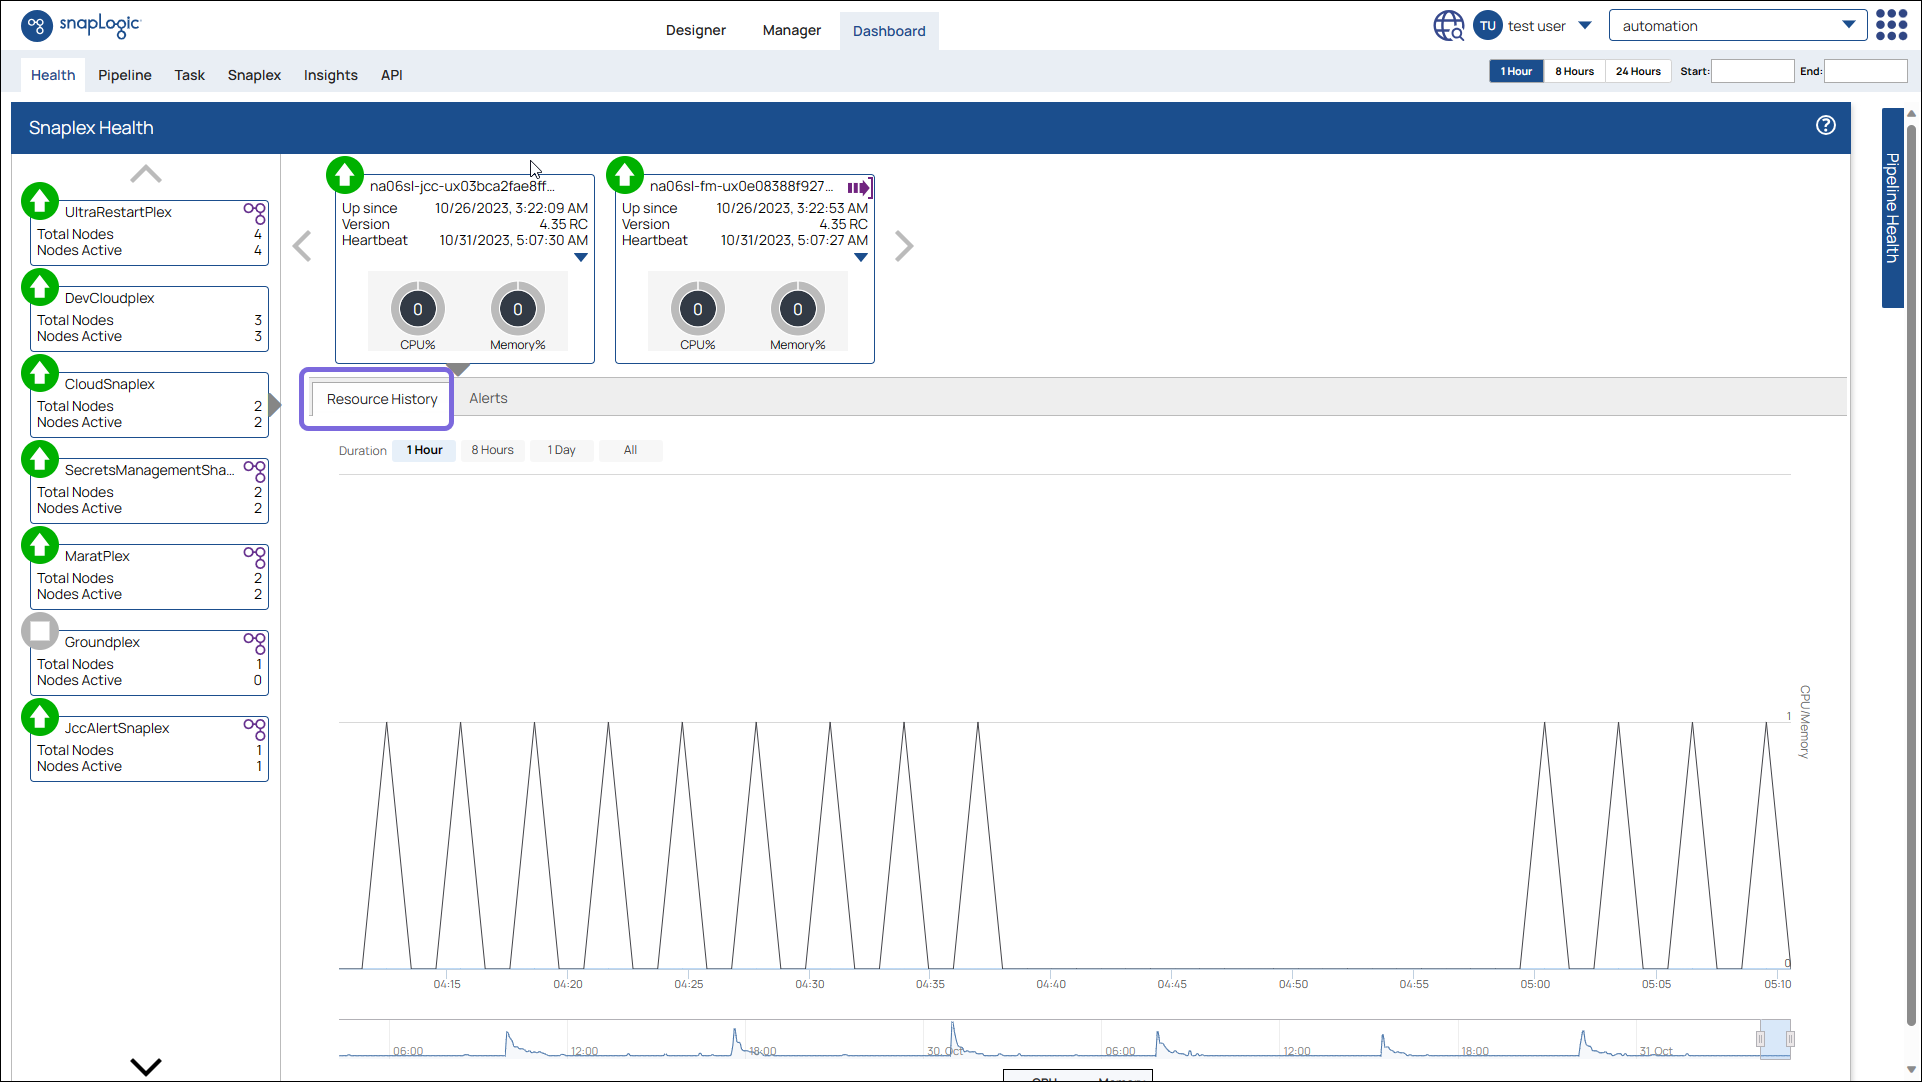
Click inside the Snaplex Health panel to expand it:
In the Snaplex Health wall, the different icons indicate whether the Snaplexes and their individual nodes are up or down:
| Icon | Snaplex / node status |
|---|---|
| Up and running | |
| Alert | |
| Not running | |
| Entering maintenance mode | |
| In maintenance mode | |
| Error status |
The following icon indicates the type of Snaplex:
| Icon | Type of Snaplex |
|---|---|
| Groundplex (Self-managed Snaplex) |
SnapLogic-managed Snaplexes (Cloudplexes) do not display an icon on the top right corner.
SnapLogic-managed Snaplexes
Some SnapLogic-managed Snaplexes in the EMEA region display the Groundplex icon because of their setup.
The following icon indicates the node's role:
Icon | Node Role |
|---|---|
| JCC node | |
| FeedMaster node |
You can click on a Snaplex to view the following details on the JCC level:
- Date of creation
- Version
- Heartbeat time
- CPU and JVM Memory usage
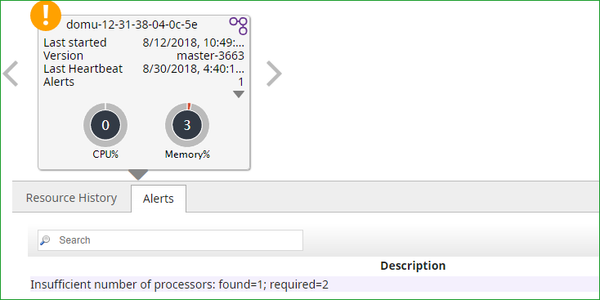
- Any alerts that may be coming from the Snaplex
Heartbeat
A heartbeat is a periodic message sent by the Snaplex nodes to the SnapLogic Control Plane indicating the health of the node. The heartbeats are sent every 20 seconds and are used to troubleshoot node issues.
Node Actions
Click the down arrow within the Snaplex dialog for additional node information and node restart option (available only to Org admins). The additional information includes:
- Total processors
- Machine memory, JVM memory, and memory used
- OS architecture, name, and version of the host machine
- Number of max file descriptors and open file descriptors
- Number of active threads
- If a FeedMaster is configured, you will also see:
- Connected nodes
- Requests in progress, including the task names and queue sizes.
- For a Groundplex, you can view the URI of the node and the secure URI of the node
- See executing pipelines opens the Pipeline tab in Dashboard, filtered to the selected Snaplex node.
- Setting Maintenance completes any current jobs on the node and then prevent additional jobs from being run on that node until Undo Maintenance is selected.
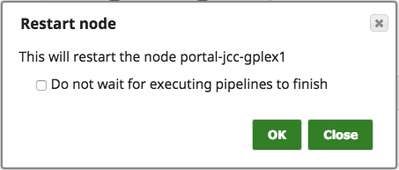
- The Restart option lets you determine whether or not to wait for executing Pipelines to finish.
Restarting nodes clears the cache for those nodes. We recommend that you do not restart your nodes while they are still in maintenance mode.
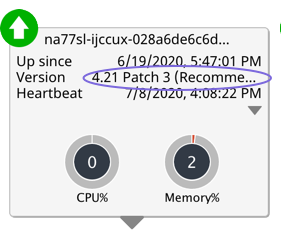
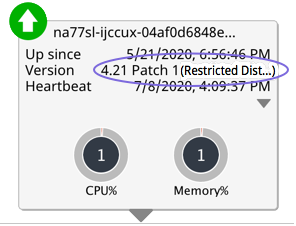
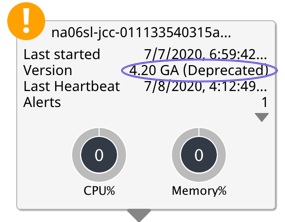
You can also view the status (Recommended, Restricted, and Deprecated) of the Release and Build listed for Version:
For details about Snaplex versions, see Updating a Snaplex.
Pipeline Health
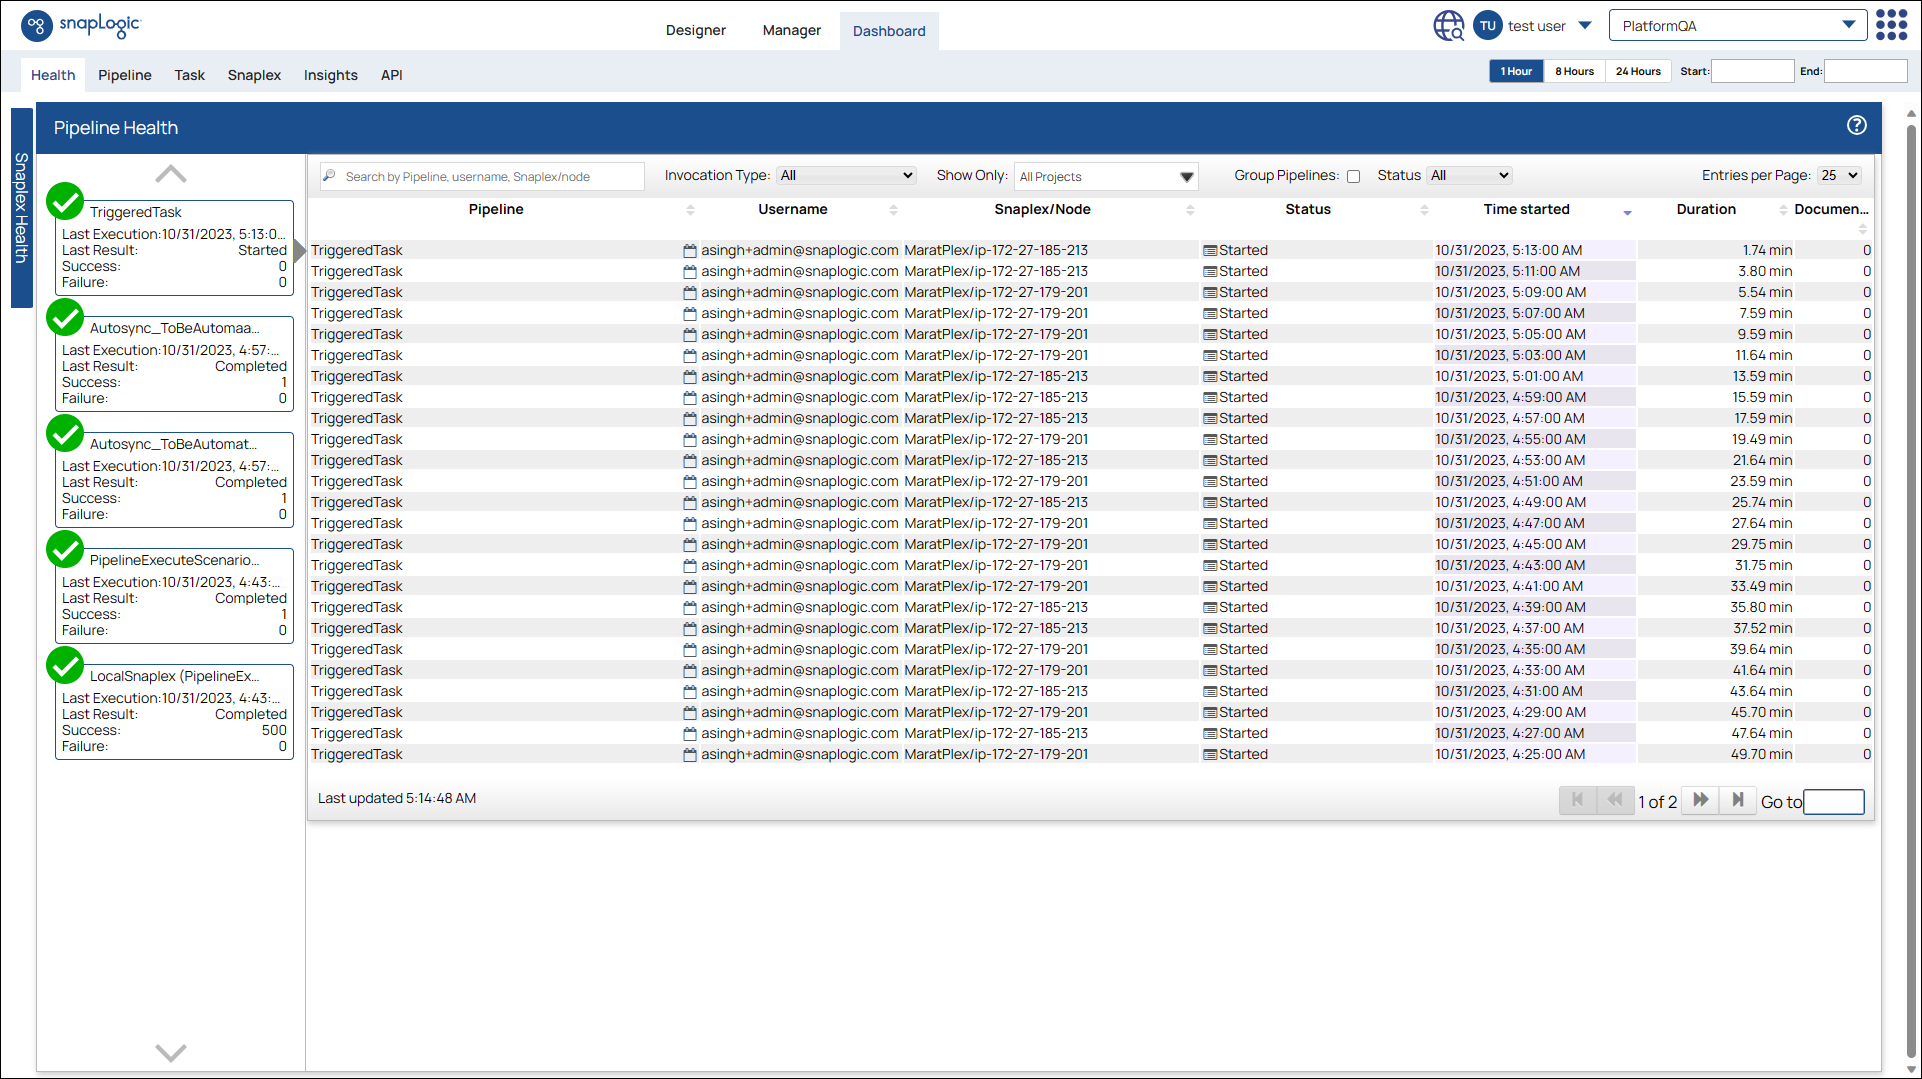
In the Pipeline Health wall, you can view the following information for individual Pipelines:
- Icons indicating the last run status of the icon
- Last run details
- Last run result
- Number of successful runs
- Number of failures
Click on an individual Pipeline to view the run history for that Pipeline:
To stop a Pipeline, click the Pipeline tab, select the target Pipeline, and then click .
Have feedback? Email documentation@snaplogic.com | Ask a question in the SnapLogic Community
© 2017-2025 SnapLogic, Inc.
