On this page
Overview
Activity Log Notifications (also known as Notifications or Alerts) let Org admins configure alert routing for specific event types within their Organizations. You must have Org admin permissions for managing alerts.
April 2024 Release
- In the February 2024 Release, a patch update has temporarily disabled all Snaplex
node cpu load avgalert notifications, which prevented Scheduled Tasks from starting. - All the existing Snaplex
node cpu load avgnotifications are now enabled. This issue was fixed after the Snaplex Mandatory Automatic Upgrade, completed on Saturday, Mar 16, 2024.
Support for Notifications through Slack
SnapLogic supports the Slack messaging app within the SnapLogic platform communications, enabling you as an Org admin to add Slack channels and recipients for your SnapLogic communications. For details on adding Slack communications to your Org, see SnapLogic Notifications through Slack.
You can create notifications that notify users based on the following events.
- ACL: Changes to Asset Control List (ACL) for a project.
- API: Threshold violation for API usage.
- Asset: Changes to assets.
- Dist: Changes in the distribution version of Snaplex instances.
- Group: Changes to groups (creation, deletion, and update).
- Session: Session start and end times for users.
- Snaplex: Alerts to changes in Snaplex state, size or condition
- Snaplex Node: Threshold violations for performance.
- Task: Threshold violations for performance and reliability.
- User: Changes to SnapLogic login credentials and access.
Managing Notifications
As an Org admin, you can create notification rules, view and delete notifications, and use them for tracking Snaplex congestion.
Creating Notification Rules
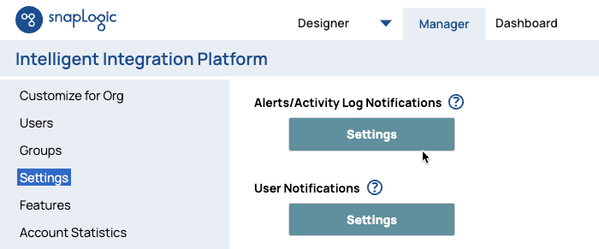
- Navigate to SnapLogic Manager > Settings, scroll down the page to Alerts/Activity Log Notifications, and click Settings.
- In the Settings > Notifications page, click Create Notification to display the Create Notification Rule dialog.
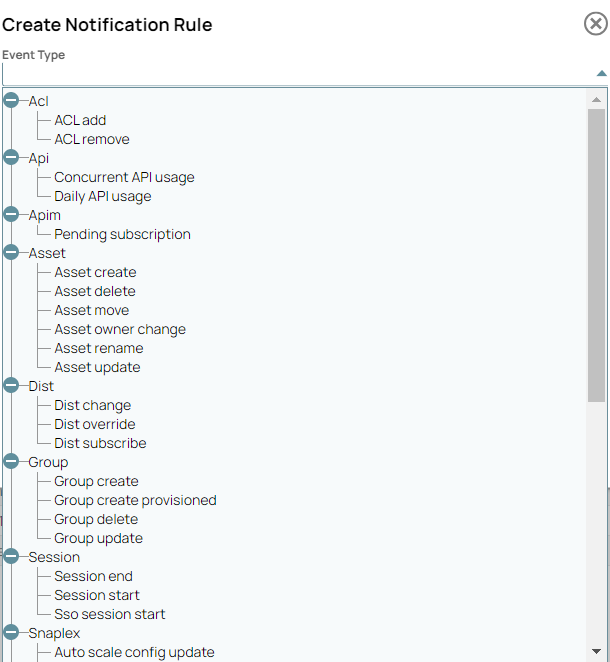
- In the Create Notification Rule dialog, click Event Type to display the drop-down list:
Refer to Event Type Parameters for a list of the Event Types and associated fields. - Select the target Event Type and enter information for the displayed fields.
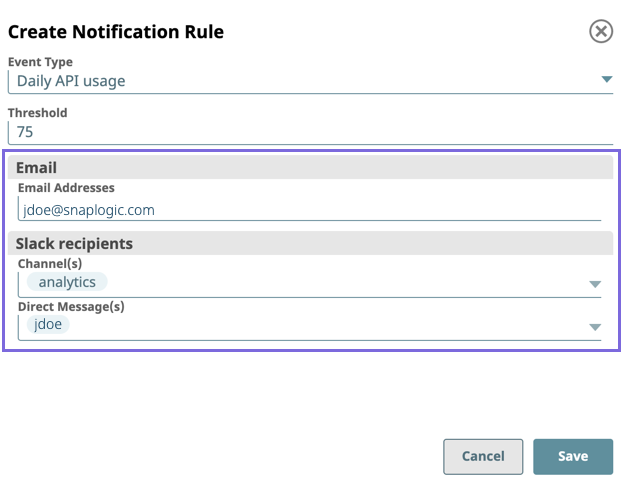
- For notification recipients, enter the recipient's email address or Slack channel. To send a direct message, enter the Slack username.
- For specific parameters for each event type, see the Event Type Parameters.
- Click Save to exit.
You can go to Settings > Notifications to validate that your notification is created.
Viewing Alert Information
- Log in to SnapLogic and click the Manager tab.
The Organization Settings page appears to display the Settings controls. - In the left pane, click Alerts to display All the alerts in an Org.
- To filter the Open and Closed alerts, click the corresponding tabs.
- To filter the alerts by time period, enter the target Start and End dates.
- (Optional) Click the download icon () to download as a CSV file.
Updating Notifications
- Navigate to SnapLogic Manager > Settings, scroll down the page to Alerts/Activity Log Notifications, and click Settings.
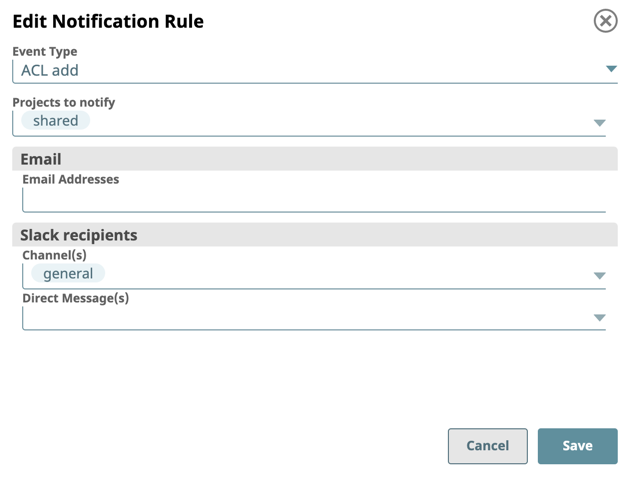
- In the Settings > Notifications page, click any notification to display the Edit Notification Rule dialog:
- Edit the notification as required and click Save.
You can make the following changes:- Event Type. Change to any event type.
- Projects to notify. Select target project folders
- Email. Add or remove email addresses.
- Slack Recipients. Add or remove Slack channels and usernames.
Deleting a Notification
- Log in to SnapLogic and click the Manager tab.
The Organization Settings page appears to display the Settings controls. - Scroll down the page to Alerts/Activity Log Notifications and click Settings.
The Settings > Notifications page displays the list of alerts. - Click the Delete Notification icon () next to the alert that you want to delete.
The alert disappears from the list.
Use Alerts to Track Snaplex Congestion
Snaplex alerts are generated in the following scenarios:
- One or more Pipelines are in the Queued state on a Snaplex for more than:
- the 75% of their respective Time To Live (TTL), or
- the maximum time that SnapLogic attempts to execute a Pipeline.
- The daily API usage exceeds 75% of the limit.
- The concurrent API usage exceeds 75% of the limit.
You must always investigate the cause of a Snaplex congestion Alert. Frequently queuing Alerts indicate that either the Snaplex needs more capacity or the running Pipelines need a redesign.
Open Alerts
A scheduled job runs every 5 minutes to monitor the queued Pipelines. If it detects any Pipeline above the 75% of TTL threshold at that instant, it generates an Open Alert. However, if an Open Alert already exists for that Snaplex, a new Alert is not generated. The previous Open Alert remains in the same state.
After generating an Open Alert the scheduled job repeats monitoring the Pipelines that have been queued for more than 75% of their respective TTLs. If there are no Pipelines above the threshold for that Snaplex, the Alert is resolved and its state changes to Closed.
Event Type Parameters
Use the following table to understand the event types and corresponding parameters for creating notification rules in different scenarios. Pending subscription API/Proxy to notify: Select a published API Email: Enter the email addresses of the recipients Slack > Channel(s): List the Slack channels Slack > Direct Messag(es): List the Slack recipients. API admin: Select to receive notifications when the APIs you publish on your Org’s Developer Portal have pending subscriptions. When API consumers on the Developer Portal request access to your API for use in their application, you receive the notification at the email or Slack Channe/recipient entered in the notification. Asset create Asset delete Asset owner change Asset rename Dist change Group create Group delete Session start None: Informational The notification indicates which user (by user email) started or ended a session and the following details about the user: Auto scale config update Snaplex node connection rejected CPU utilization: Enter the target threshold for CPU utilization as an integer value. When the CPU usage exceeds this value, a notification is sent. The threshold value setting depends on the server host for the node and might require adjustment. The following example values are based on internal testing. Snaplex: Select the target Snaplex from the drop-down list. Email Addresses: Specify the email address of the intended recipients of the event. Threshold: Enter this value as the remaining amount of disk space. Make sure you specify the capacity size in GB, MB, KB. When the free space available falls below this value, the alert notification is sent. Usage Threshold: Enter the threshold as a percentage of the amount of memory the user is limited to. Snaplex: Select the target Snaplex from the drop-down list. Threshold: Enter the threshold as a percentage based on the 30-day historical executions. Investigate the following potential issues that could prevent the Task execution from completion: Apply to: Select one of the following options. Password reset linkEvent Type Event Type Specific Parameters Suggested Action for Recipients ACL ACL add Projects to notify: Select the Projects from the drop-down list to which this event applies. Consult your Org admin if you have received this notification. Your access to a project might have changed. ACL remove API Concurrent API usage Threshold: Enter the limit as a percentage of usage allowed.
Recipients: Enter the email addresses of the intended recipients of the event.Monitor your usage of APIs. Consult your Org admin if the percentage needs to be increased. Daily API usage Apim Asset Projects to notify: Select the Projects from the drop-down list to which this event applies. Consult your Org admin if your assets have been deleted moved, renamed, or if ownership has changed without your knowledge. Asset move Asset update Dist N/A None: Informational Dist override Dist subscribe Group N/A None: Informational Group create provisioned Group update Session N/A Session end Sso session start Snaplex N/A Choose another Snaplex from which to run your Pipelines. Snaplex congestion Snaplex node add Snaplex node crash Snaplex node enter maintenance mode Snaplex node leave maintenance mode Snaplex node restart Snaplex version update Snaplex Node Snaplex node cpu load avg 3 (cores)5010Run your Pipelines on another Snaplex until more resources are allocated to the Snaplex or activity by other users decreases. Snaplex node disk usage
Snaplex: Select the target Snaplex from the drop-down list.
Type of the disk space: Enter the filesystem type (NFS, CIFS, TMP).
Name of the disk space: User given name for the space, if any.proc, tmpfs, devtmpfs, rootfs.Run your Pipelines on another Snaplex until more resources are allocated to the Snaplex or activity by other users decreases. Snaplex node memory usage Run your Pipelines on another Snaplex until more resources are allocated to the Snaplex or activity by other users decreases. Task Task execution duration - percentage of normal Task execution duration - time limit Threshold: Enter the threshold in minutes. User Password change N/A Consult your Org admin about your sign-on access. Password reset User authentication failure User create User delete User lockout User unlock User update
In Manager, you can configure notifications to receive an email or a Slack message when a node in a Snaplex fails or crashes. When you set a notification rule, a Snaplex node crash option is available under Snaplex. To create, update or manage notifications, refer to Manage Notifications. You can also view the node fail/crash information on the Manager > Alerts tab. A red triangle indicates the status of a new alert, and if the alert is older than an hour, the status is indicated by a gray triangle. To view alerts, refer to Viewing Alert Information.
Snaplex Node Notification Threshold Watermarks
You can adjust the behavior of the alerting system with threshold watermarks. In some scenarios, an alert is set against a CPU, memory, or disk resource that is overutilized, but not directly by Pipeline executions. For example, a disk alert might be triggered by accumulative files in a /temp directory mounted on the Snaplex node; in this case, the Org admin would put the Snaplex in maintenance mode and devops might clear the space in the directory. Threshold watermarks enhance the reporting accuracy of Snaplex node alerts and can be used to reduce the frequency of alerts.
For memory and CPU usage, the alert is removed when the usage falls below the lower watermark which is 40% below the threshold by default. For example: If you have set a threshold of 80% for memory usage, and there is an an alert present that is addressed by a user action, then the alert is removed from the Dashboard when the memory goes below 0.4 * 80 = 32%. Similarly, for disk alerts the high watermark is 40% above the threshold. So if the free space on the disk extends beyond 40% of the threshold then the alert is removed.
You can configure the following threshold watermarks through enabling a feature flag for your Org.
- com.snaplogic.cc.service.UsageMonitorServiceImpl.LOW_WATERMARK = 0.4
- com.snaplogic.cc.service.UsageMonitorServiceImpl.HIGH_WATERMARK = 1.04
Enabling the Threshold Watermark Feature Flag
- Obtain your Org ID by navigating to Manager > Settings. You can find your Org ID below Organization Id at the top of the Settings page. Alternatively, you can run the following API call:
https://elastic.snaplogic.com/api/1/rest/asset/<org_name>
The API call requires authentication. In the returned response, the Org Id is the value to theorg_snode_idkey. Check to see if you have any feature flags already set for your Org.
Important
If you have other existing feature flags set for your Org, then they must be appended to the request in Step 3. Contact SnapLogic Support for questions about current feature flags.
Make the following request from a browser:
https://elastic.snaplogic.com/api/1/rest/admin/snappack/org-dist/<org_snode_id>
Sample Response{ "response_map": { "overrides": {}, "_id": "52e99318640a9a03d8681d0d", "flag_overrides": { <Existing_feature_flag> }, "dist_id": "latest" }, "http_status_code": 200 }Where
<Existing_feature_flags>are the feature flags that are already enabled in the Org.- Make note of any existing feature flags for Step 3.
Apply the following feature flag to a specific Org, appending any existing feature flags from Step 2.
"com.snaplogic.cc.service.UsageMonitorServiceImpl.LOW_WATERMARK = 0.4"
"com.snaplogic.cc.service.UsageMonitorServiceImpl.HIGH_WATERMARK = 1.04"
Sample Curl Command for Enabling Threshold Watermarkscurl -u <org_admin_username> -H 'Content-Type: application/json' --data-binary '{"flag_overrides": { "com.snaplogic.cc.service.UsageMonitorServiceImpl.LOW_WATERMARK = 0.4":"true", "com.snaplogic.cc.service.UsageMonitorServiceImpl.HIGH_WATERMARK = 1.04":"true"...
<Existing_feature_flags>
...}}' https://elastic.snaplogic.com/api/1/rest/admin/snappack/org-dist/<org_snode_id>Where:
The
org_admin_usernameis the username of the Org admin.The
org_snode_idvalue is the Org ID (for example: 52e44318640a9a03d8681d0d).<Existing_feature_flag> indicates any existing feature flags from Step 2a.
To verify that the threshold watermark feature flag is enabled for a specific Org, make the following request in a browser:
Requesthttps://elastic.snaplogic.com/api/1/rest/admin/snappack/org-dist/<org_snode_id>
Navigate to the Dashboard to monitor the resource utilization of your Snaplex nodes against the alert reporting.
To verify that the threshold watermarks are enabled for a specific Org, make the following request in a browser:
https://elastic.snaplogic.com/api/1/rest/admin/snappack/org-dist/<org_snode_id>


