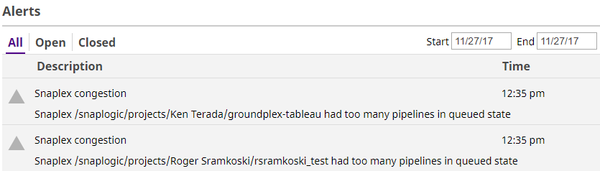
The Alerts page provides a way for org admins to track changes to alerts within their organization. Data can be queried over a time range and filtered by alert status (all, opened, or closed). Click the download button to download the alerts log.
Alerts track Snaplex congestion. Snaplex alerts are generated when:
- one or more pipelines have been in the "Queued" state on a Snaplex for more than 75% of their respective Time To Live (TTL, or the maximum time that SnapLogic will attempt to execute a pipeline). At most one alert is generated per Snaplex regardless of the number of pipelines over the threshold. The default pipeline TTL is 5 minutes.
The daily API usage exceeded 75% of the limit.
The concurrent API usage exceeded 75% of the limit.
A scheduled job runs every five minutes to check for pipelines that are in "Queued" state. If it detects any pipeline above the 75% of TTL threshold at that instant, it will generate an "open" alert. Note, however, that if there already was an "open" alert for that Snaplex, then nothing happens. The previously "open" alert stays in the same state. After an "open" alert has been generated, the next scan by the scheduled job repeats the same check for pipelines that have been queued for more than 75% of their respective TTLs. If there are no pipelines above the threshold for that Snaplex, the alert will be resolved and it's state changed to "closed".
When a Snaplex congestion alert is opened, it is worth investigating the cause of that alert. Seeing the queuing alert frequently could indicate that more capacity needs to be added to that Snaplex or that the pipelines being run need a redesign.