In this Page
| Table of Contents | ||
|---|---|---|
|
| Panel | ||||
|---|---|---|---|---|
| ||||
In this Section
|
Overview
You can access the Pipeline
Wall from the SnapLogic Dashboard. The Pipeline Wall enables you to view details of all the
pipelines executed within the Org. Organized into two sections, the Pipeline Wall separates all executing
pipelines from those that have completed execution. For each
pipeline, the Pipeline Wall shows you a series of details, such as the
pipeline name, the username of the user who executed it, and the Snaplex and node in which the Pipeline was executed. Refer to Monitoring Ultra Pipeline Tasks in the SnapLogic Dashboard for specific details about Ultra Task Pipelines.
Additionally, you can
check execution statistics for a Pipeline, view associated run logs
, and search for a
pipeline using
its name,
username, Snaplex, and values of
pipeline and error
pipeline parameters.
| Note |
|---|
Pipelines may not be ordered by timestamp on initial load. |
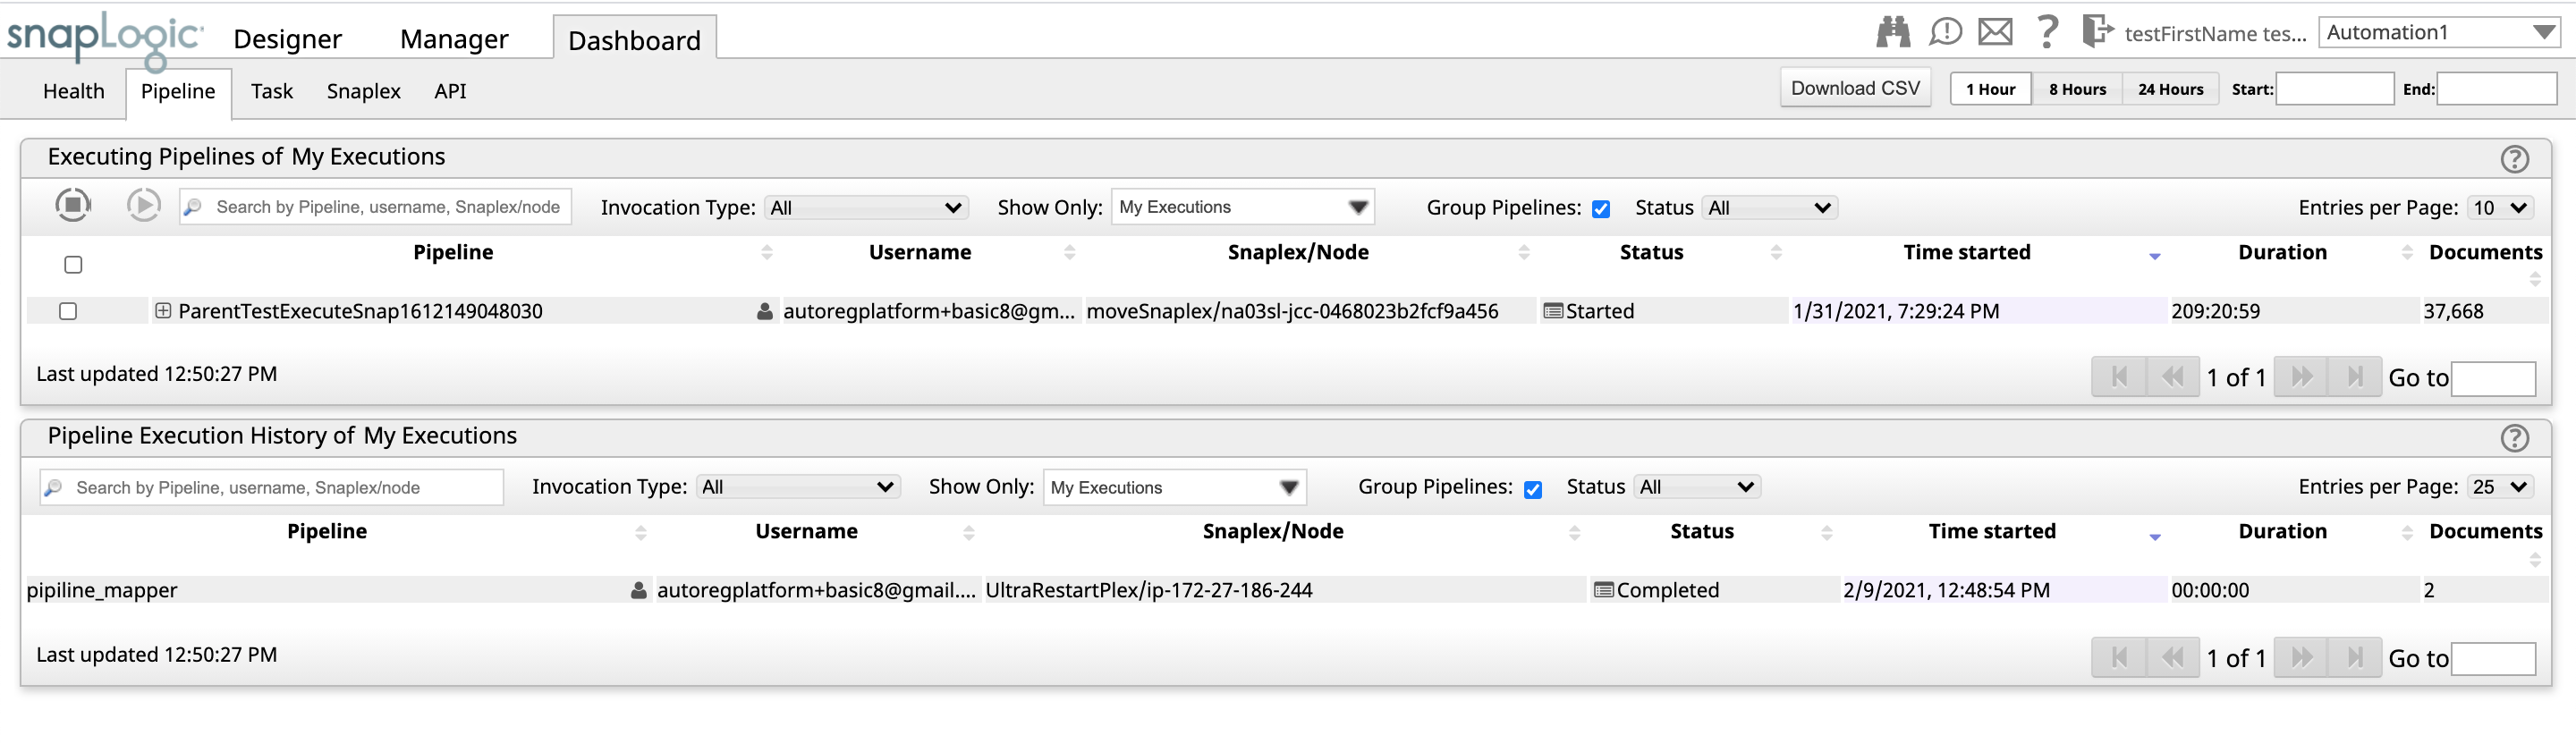
Pipeline Wall
The Pipeline Wall comprises
two sections:
Executing Pipelines
. Displays all pipelines that are either queued to execute or being executed.
Pipeline Execution History. Displays all pipelines that either completed execution (successfully or with errors) or were stopped manually.
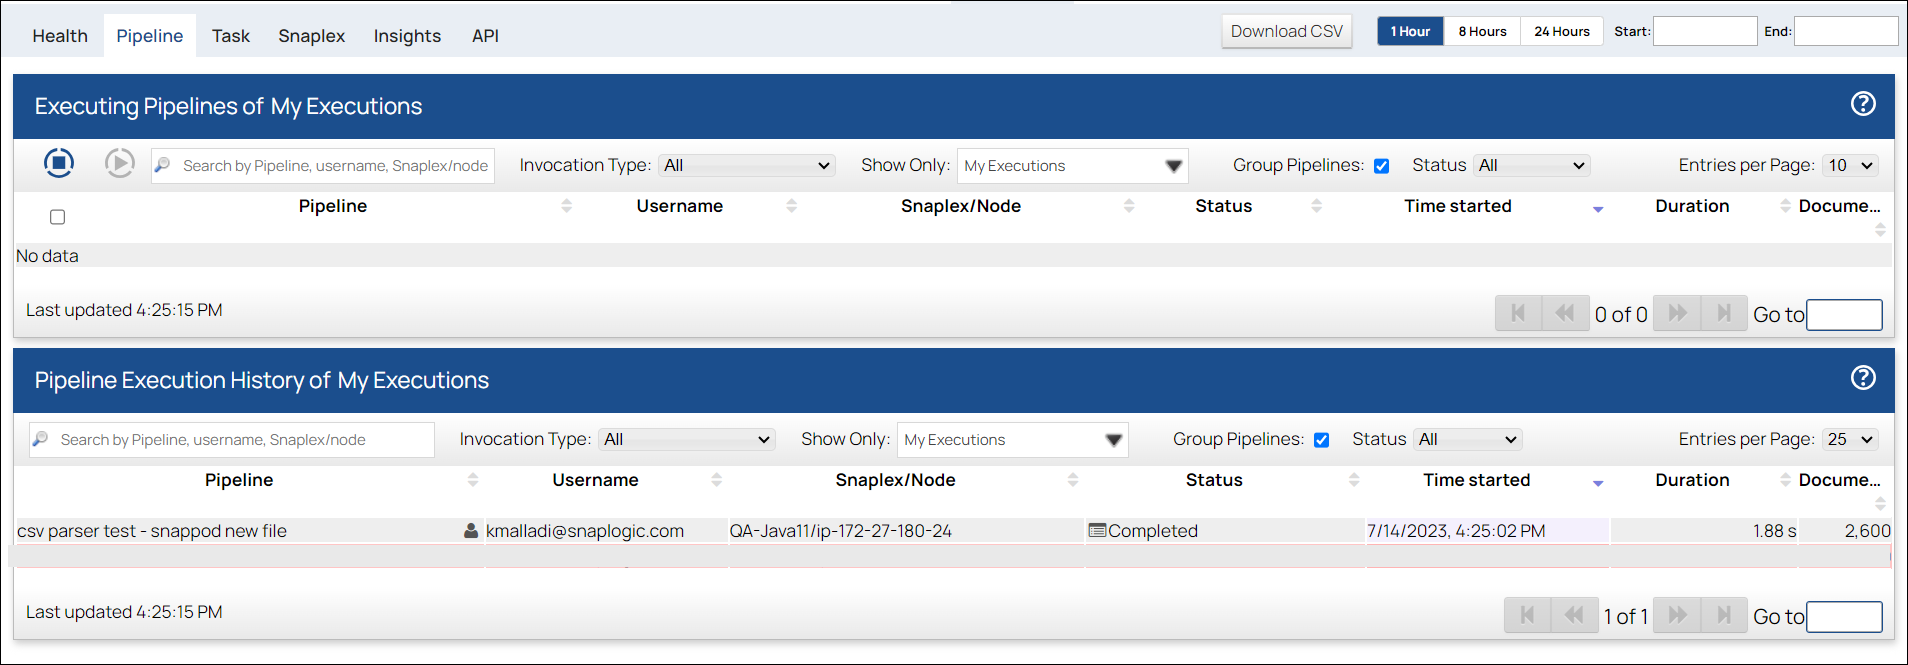
By default, the sections are titled Executing Pipelines of My Executions and Pipeline Execution History of My Executions.
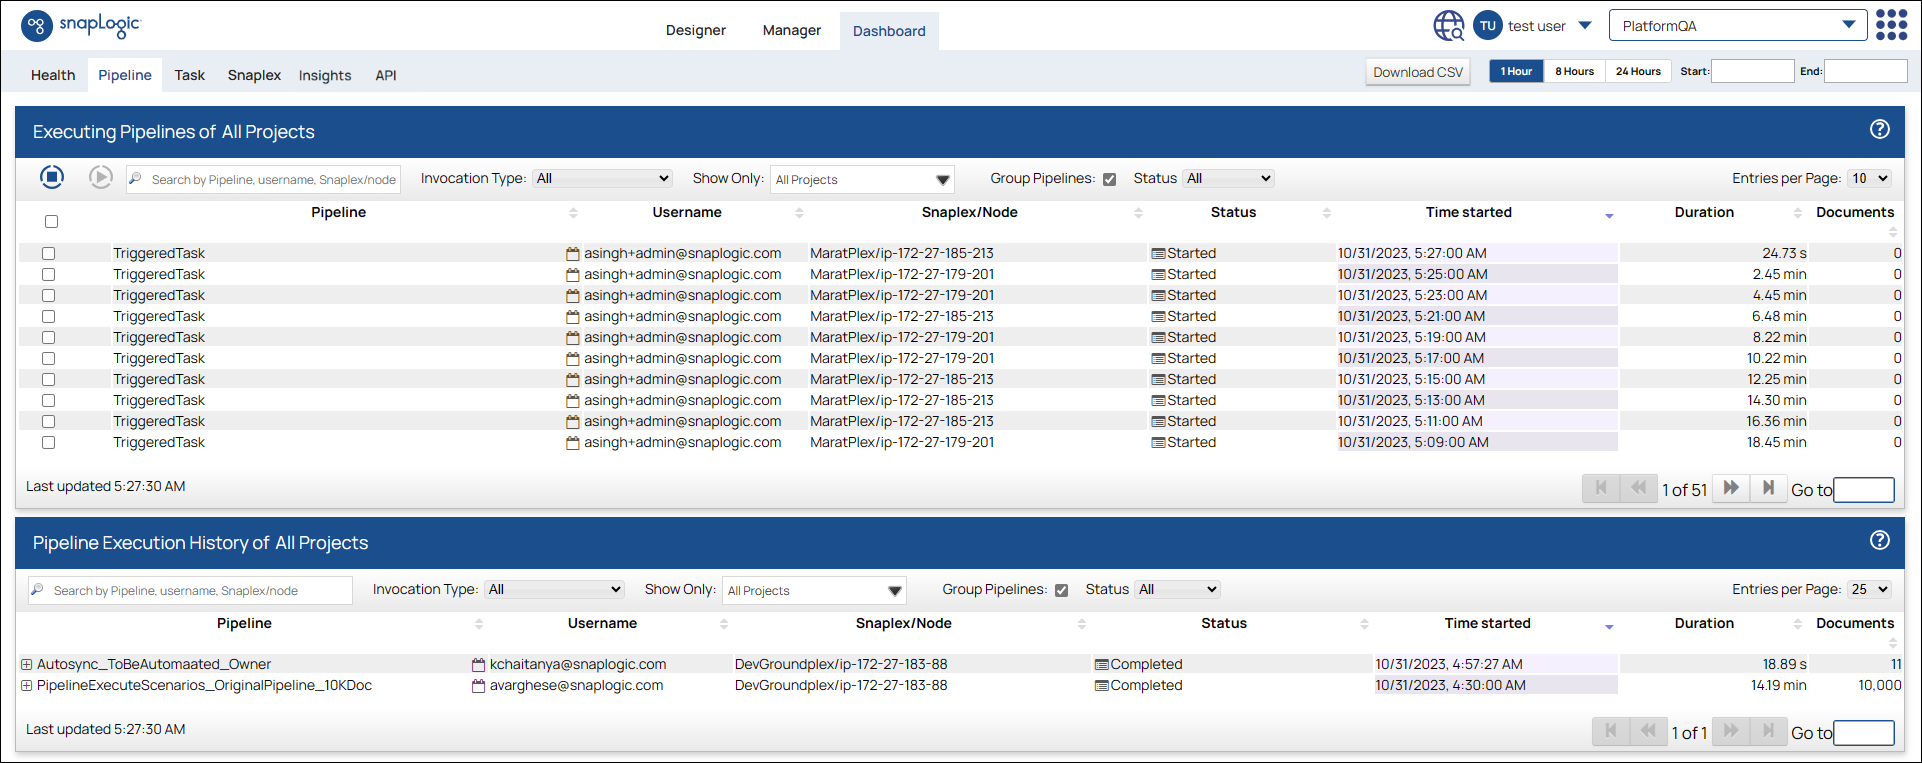
For Org admins, the sections are titled Executing Pipelines of All Projects and Pipeline Execution History of All Projects.
The section titles vary depending on the value you select
for Show Only. For example, if you select shared
, the titles
read Executing Pipelines of shared and Pipeline Execution History of shared, respectively.
For simplicity we will refer to these sections using their default titles: Executing Pipelines of All Executions and Pipeline Execution History of All Executions.
The Executing Pipelines of All Projects section displays all Pipelines that are either queued to execute or being executed. The Pipeline Execution History of All Projects section displays all Pipelines that either completed execution, or failed, or were stopped manually.
Aside from the two sections described above, the Pipeline Wall's components can be classified as Report Generation, Date/Time-Range Filter, and Pipeline Attribute Filter. A brief description of the components in this screen is given in the sections that follow.
Report Generation
Generate a CSV-format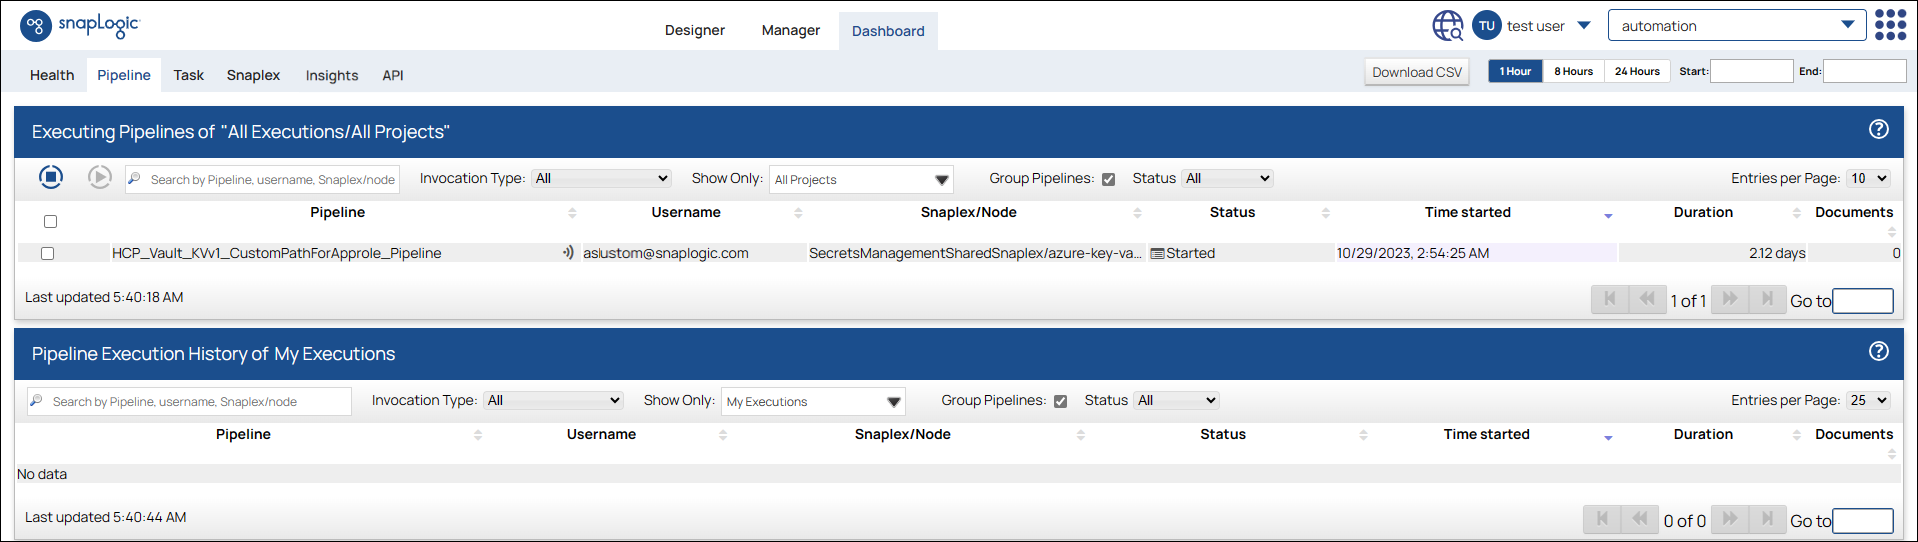
The Pipeline Wall enables you to:
Generate Reports
To generate a CSV-formatted report of all the Pipelines displayed
on the Pipeline Wall
, click the Download CSV button
.
The CSV file contains the following information:
Pipeline Link
Pipeline Name
Username
Snaplex
Status
Time Started
Duration
Document Count
Date/Time-Range Filter
Specify a time-range or a date-range for which to show your results.
| Info |
|---|
|
Filter by Date/Time Range
To filter the results by time, you can choose one of the default time ranges:
1 Hr: Retrieve Pipelines executed in the past 1 hour.
8 Hrs: Retrieve Pipelines executed in the past 8 hours.
24 Hrs: Retrieve Pipelines executed in the past 24 hours.
To filter the results by a custom date range
, enter dates in the Start and End fields.
Filter by Pipeline Attribute
You can filter Pipelines based on a combination of any of
the Pipeline attributes, which you can select using UI controls on the Pipeline Wall.
UI Control | Description |
|---|---|
Search box |
A textbox that enables you to search for Pipelines matching the search criteria. The following search criteria can be used:
Filters the results based on the search string you specify. The search string is compared with the following attributes:
|
|
|
Invocation type |
Filters the results based on the method of invocation. |
You can choose from the following options |
:
|
An icon next to |
the Pipeline indicates its invocation type. |
| title | Legend: Pipeline types |
|---|

|
|

|
|
|
|
|
|
|
Show |
Only |
Filters the results based on the project space. Select a space from the |
dropdown to |
return only Pipelines |
in that space. |
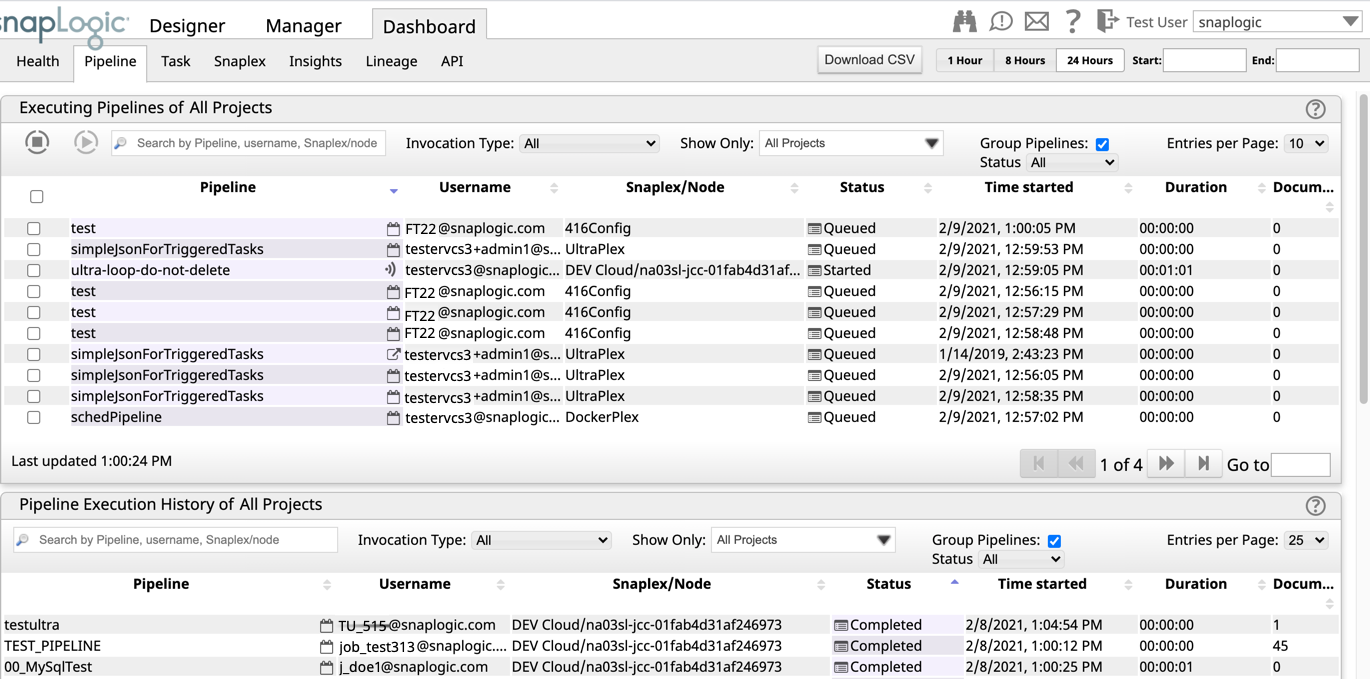
Group Pipelines |
If selected, displays the parent and child Pipelines in a hierarchical tree. If one Pipeline calls another, a plus sign (+) appears next to the parent Pipeline. You can click on the plus sign to see the child Pipelines that the parent |
calls. 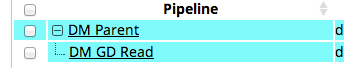
|
|
In cases where a large number of child Pipelines are being executed, the Dashboard shows data for only 100 child Pipelines.
| |
Status | Filters the results based on the execution status of the Pipeline. The options |
vary between two sections. In the Executing Pipelines section:
|
In the Pipeline Execution History section:
|
|
|
|
|