Run Snaplex Diagnostics
Run Snaplex diagnostics to verify your Snaplex host environment and generate an HTML report to help you troubleshoot any issues. The Snaplex node is checked for minimum hardware requirements (RAM and disk storage), JRE version, network connectivity, and so on.
To start the diagnostic utility:
Log into the Groundplex host machine.
Navigate to the
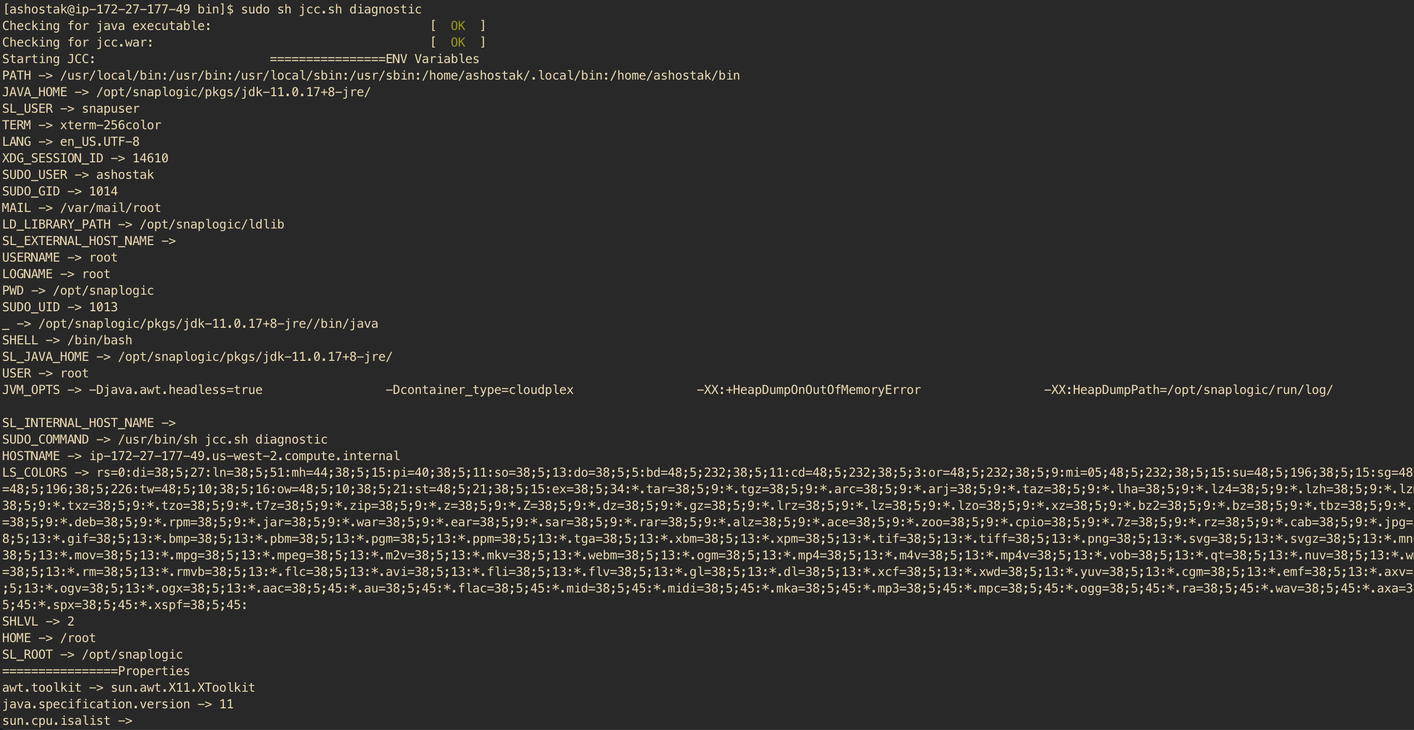
/opt/snaplogic/bindirectory.Depending on your host operating system, use one of the following commands to start the diagnostic utility on the Snaplogic node:
Linux:./jcc.sh diagnostic
Windows:jcc.bat diagnostic
As the diagnostic utility starts, the following message appears:Starting Snaplogic Snaplex in diagnostics mode:In a few minutes, when the report is complete, the following message appears:
A diagnostic report has been generated at: C:\opt\snaplogic\run\log\diagnostic_report.htmlTo view the report, do one or more of the following steps:
For the Linux environment, the diagnostic report is embedded into the terminal.
Use the SCP command in the Linux environment to view the report page from your local machine. Refer to file for detailed information: Diagnostic report.html
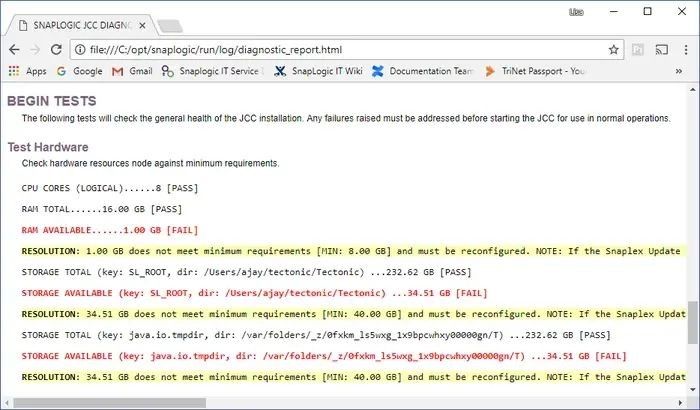
In the Windows environment, open the report in a web browser to see if there are any issues. For example:
Managing Disk Volumes
For managing disk volumes, refer to Installing a Snaplex on Linux#Manage-disk-volumes-for-Groundplex-nodes.
See Also
Have feedback? Email documentation@snaplogic.com | Ask a question in the SnapLogic Community
© 2017-2025 SnapLogic, Inc.

