Monitor and Troubleshoot Triggered Tasks
- John Brinckwirth
You can view execution information about your Triggered Tasks on the SnapLogic Dashboard. On the Pipeline tab in the Dashboard, Tasks are designated by the ![]() icon, which you click to display Task details. To filter the display of Pipeline executions for Triggered Tasks, you can choose API Calls in the Invocation Type selector.
icon, which you click to display Task details. To filter the display of Pipeline executions for Triggered Tasks, you can choose API Calls in the Invocation Type selector.
Debugging Mode
To make it easier to debug Triggered Task executions of Pipelines, you can check the Debug option in the Create Task dialog to record the next five invocations of the Task. When enabled, the headers and content from the HTTP request and response are saved in files on SLFS for each invocation.
For example, when you use a Triggered Task as a callback URL for another cloud service, we recommend that you enable debugging to view the response being sent to your other cloud service.
You can view the trace files in the Task Details page.
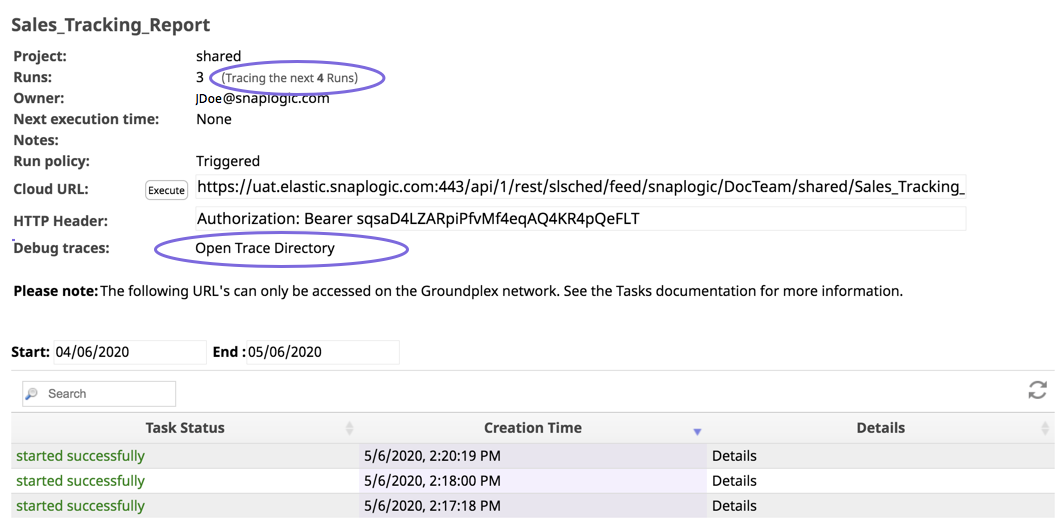
The Open Trace Directory link opens the directory containing all of the trace files for this Task. You can also search for the files for a particular invocation by clicking the View Trace Files link in the details for that invocation in the execution history. In Manager, you can check how many debug invocations remain by viewing the details page for a Task.
After the five debug invocations have been done, the Task automatically reverts to normal behavior. If you need to continue debugging, you can go back to the Task configuration dialog and re-enable debug-mode.
Task debugging is not yet available for Triggered Tasks invoked through the On-premises or Override URL.
Have feedback? Email documentation@snaplogic.com | Ask a question in the SnapLogic Community
© 2017-2025 SnapLogic, Inc.